
LCA results & interpretation VOCOMP®

Scope and summary

  • Cradle to gate
  • Cradle to gate with options
  • Cradle to grave

Application

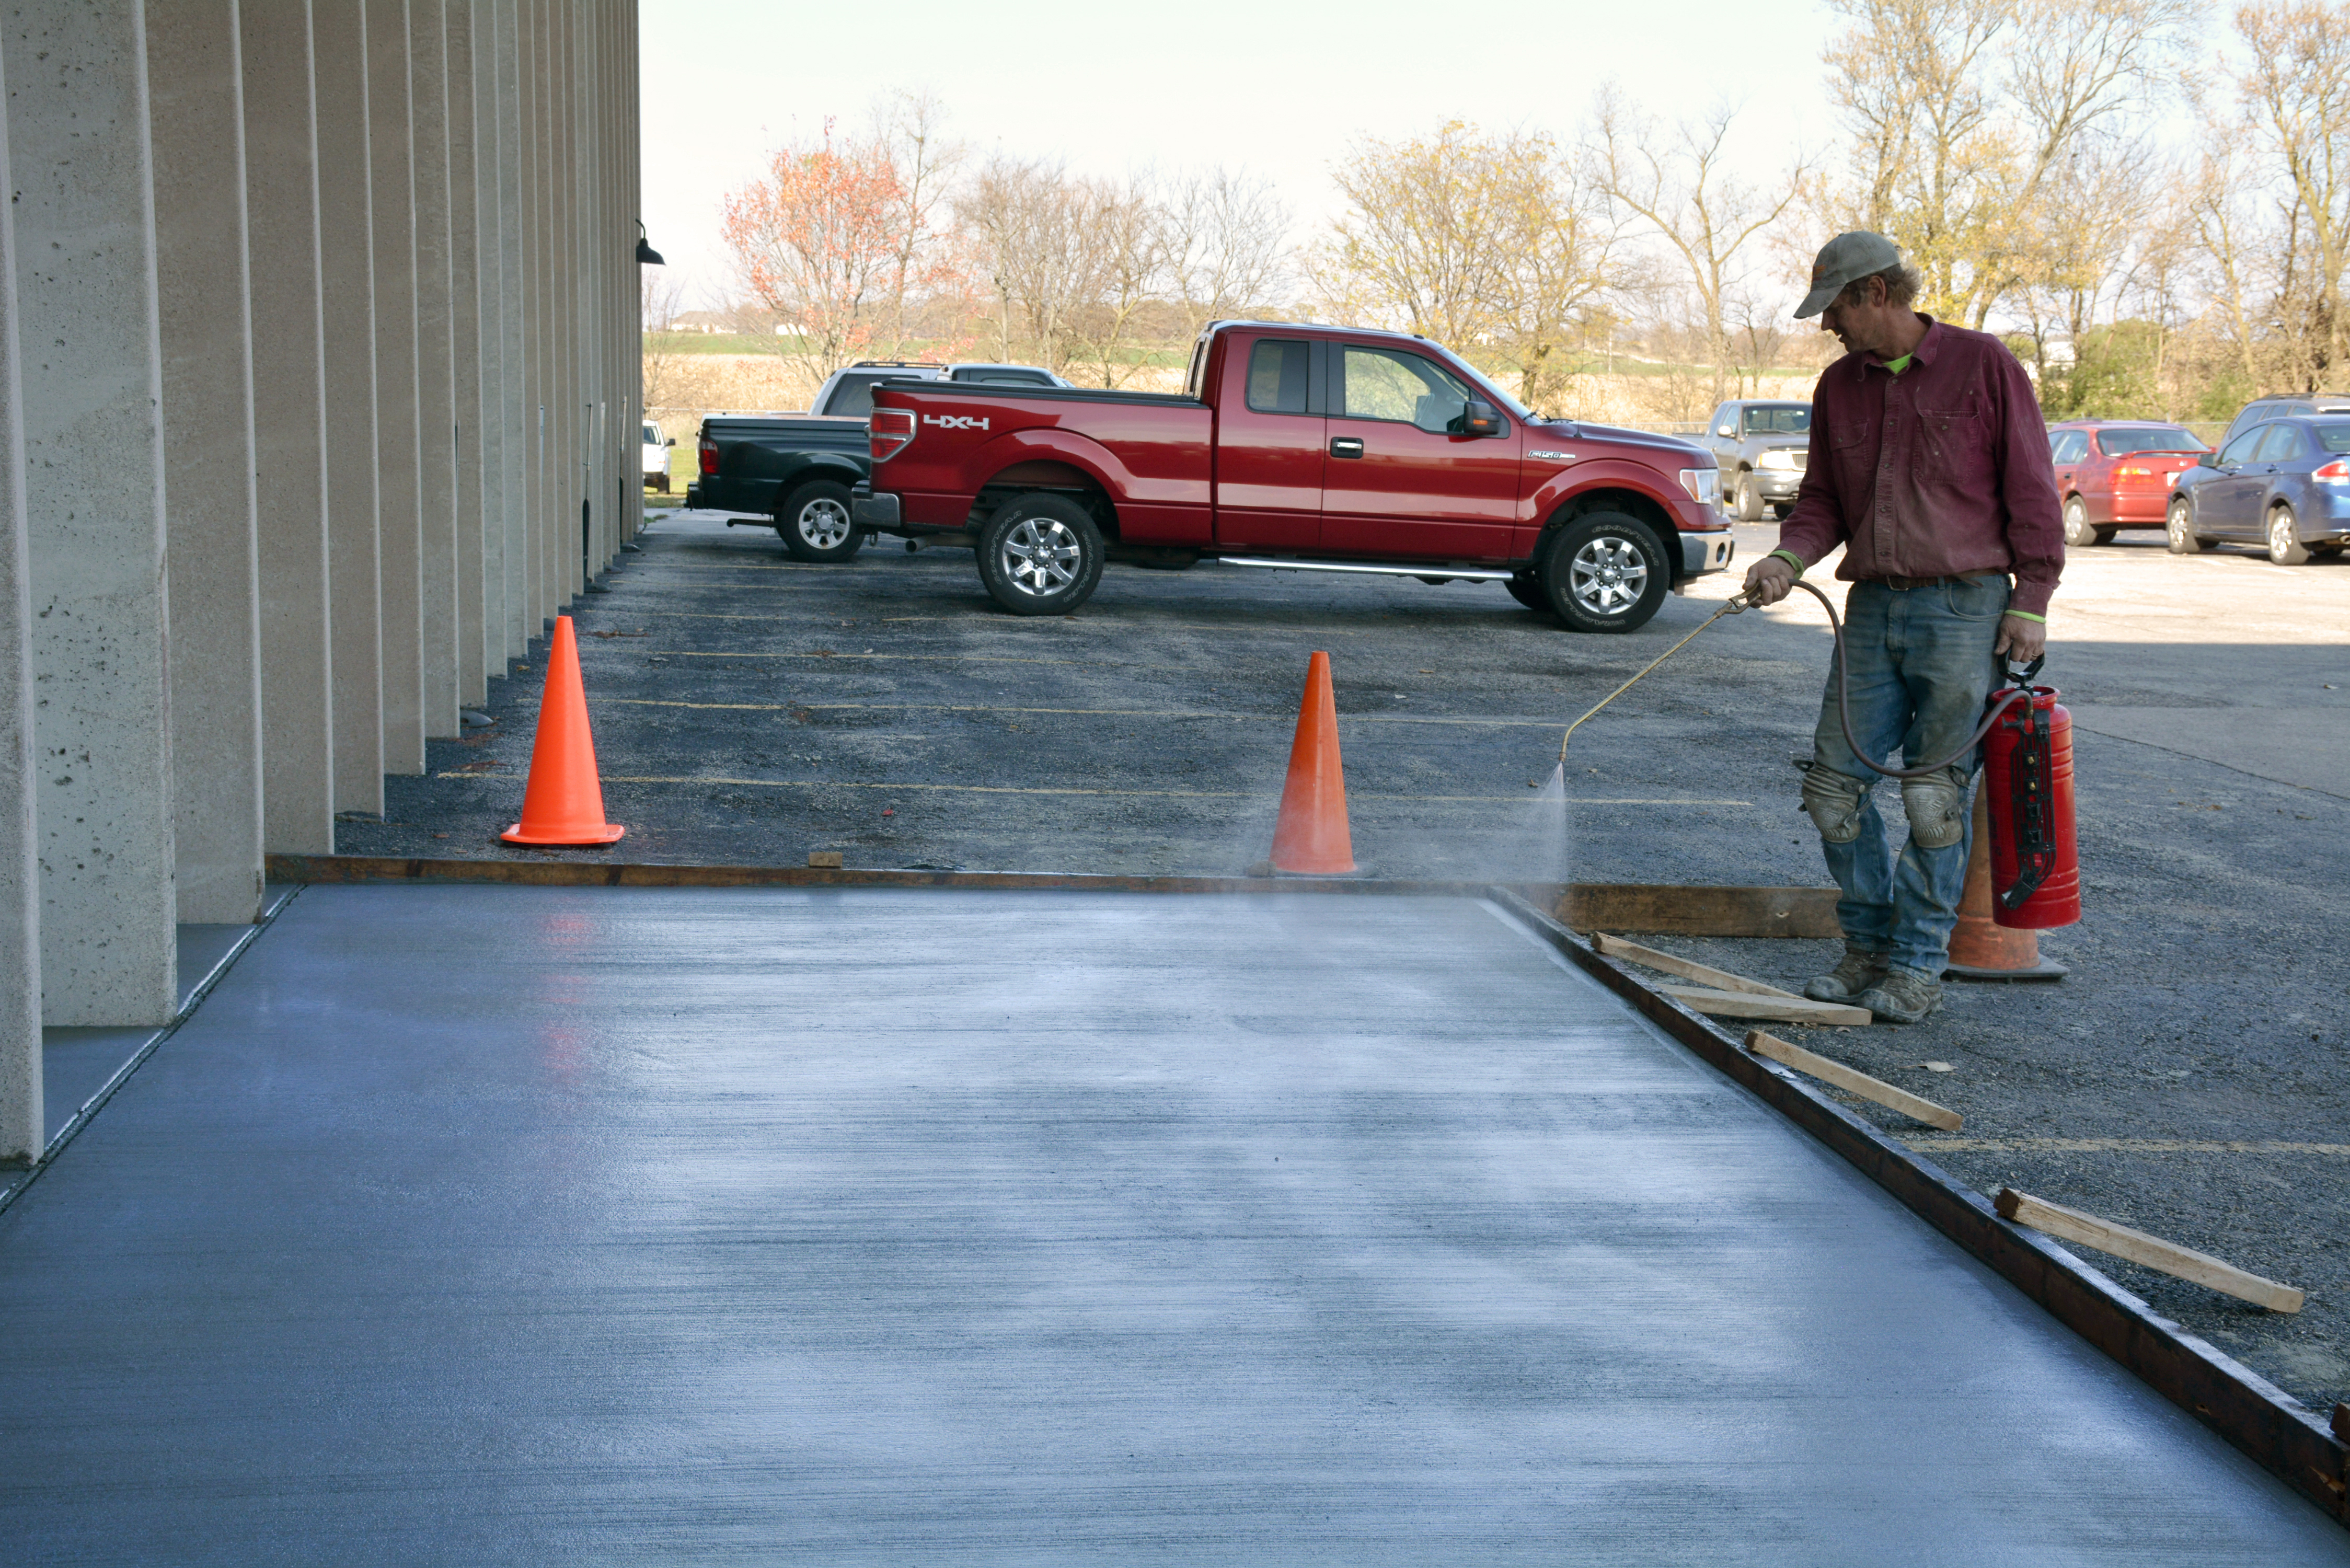
VOCOMP®-25 is a water-based acrylic concrete curing and sealing compound with a gloss finish and enhanced durability, formulated with 25% solids using acrylic polymers in a water-based carrier. VOC compliant.

Functional unit

According to the PCR, the functional unit is: 1 m2 of covered and protected substrate for a period of 60 years (the assumed average lifetime of a building).

W. R. MEADOWS' VOCOMP and MEL-PRIME products fall within the general category of curing, sealing, and priming coatings. The product life for coatings is typically defined by market lifetime (5 years) and technical life (either 5, 10, or 20 years), depending on performance and durability tests as outlined in the PCR. Since VOCOMPs are curing and sealing products, a single-use application was considered for the purposes of this study, and the functional unit considers only the initial application with no additional reapplications over the 60-year lifespan of a building. The results in this report are presented per functional unit.

Density: 8.59 lb/gal

Coverage: 9.82 m2/L

Reference flow: 0.10 kg/functional unit

Manufacturing data

Reporting period: January 2023 – December 2023
Location: Cartersville, GA, USA; Ft Worth, TX, USA; Goodyear, AZ, USA; Hampshire, IL, USA; York, PA, USA; Benicia, CA, USA; Milton, Ontario, CAN; Sherwood Park, Alberta, CAN
What’s causing the greatest impacts

All life cycle stages

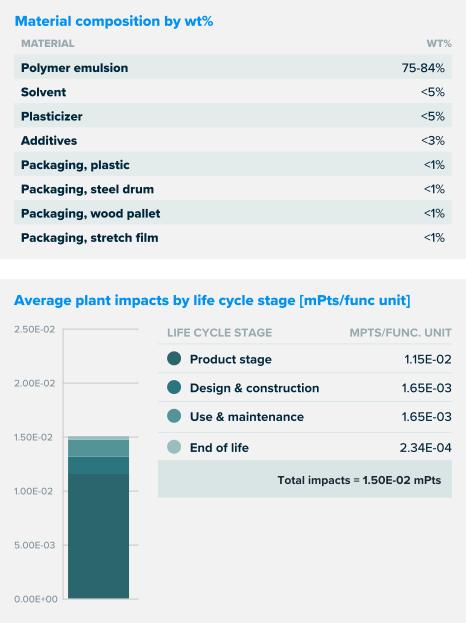
The product stage [1-1 - 1-3] dominates the results for all impact categories. The raw material manufacturing stage contributes the most to the overall impact across all locations. Coating manufacturing (1-3) and transportation stages (1-2, 2-1, and 2-2) also have significant contributions, but to a lesser extent. End-of-life management and emissions from drying show small but nonzero contributions, which reflect the packaging waste and disposal-related emissions.

Production Stage

Polymers and film-forming agents are the dominant contributors to environmental impacts in the production stage. The synthetic polymers serve as the primary functional components of the curing compound. It generates for the majority of the global warming potential and fossil fuel depletion because of their petrochemical origins and energy intensive synthesis. The blending and mixing processes used to incorporate these polymers, along with associated chemical stabilizers, contribute significantly to smog formation and ozone depletion impacts. Because the VOCOMP®-25 product is produced domestically and distributed regionally, long-distance transport impacts are minimized. In terms of manufacturing, differences in electricity grids and natural gas sourcing across plants results in various energy-related impacts.

Design & Construction Stage

Transportation to the installation site via truck is the primary contributor in the construction stage. Although this stage contributes less than 10% of total impact in most categories, regional differences in transport distances and logistics create slight variation. For instance, Cartersville and Sherwood show slightly higher construction-stage GWP and smog emissions than Hampshire or Milton. Still, these impacts remain secondary compared to production.

Use & Maintenance Stage

Use-stage impacts are minimal across all plants. The water or energy consumption during use is not accounted for or because VOCOMPs are single-use products that do not require reapplication. The curing product remains inert during its service life, with no substantial emissions or operational burden.

End-of-life Stage

Overall, the end-of-life stage plays a limited role in the environmental profile of VOCOMP®-25, with most impacts confined to background waste treatment processes. At end-of-life, VOCOMP®-25 remains adhered to concrete surfaces and is not designed for removal before demolition. The dominant impacts in this stage is from the landfilling of concrete debris coated with residual product, where trace emissions may be released during material fragmentation or disposal handling. These contributions appear in global warming, acidification, and ecotoxicity categories but remain below 5% of the total life cycle impact. Packaging materials, primarily plastic pails or metal drums, also contribute minor burdens during disposal, particularly in fossil fuel depletion and respiratory effect categories.

How we're making it greener


  • W. R. MEADOWS utilizes OEE (Overall Equipment Effectiveness) to optimize manufacturing processes and reduce energy consumption.
  • OEE identifies inefficiencies and wasted energy: By monitoring equipment performance, it uncovers downtime, slow speeds, and quality defects.
  • Energy-saving improvements through OEE: Meadows has achieved streamlined processes, better scheduling, reduced machine wear, and lower energy costs.
  • Reduction in scrap and waste: OEE insights help identify performance issues, reducing defects, delays, and material waste while enhancing product quality.
  • Supports sustainability and environmental goals: By lowering energy use and cutting carbon footprints, OEE fosters more sustainable manufacturing practices.

See how we make it greener

LCA results

Life cycle stage Production Construction USE End of Life

Information modules:
Included (X)
| Excluded (MND)*

(X) 1-1 Raw materials manufacturing (X) 2-1 Transportation to distribution center (X) 3-1 Coating application (X) 4-1 Transportation to disposal site
(X) 1-2 Transportation of raw materials to plants (X) 2-2 Transportation to point of sale/ Installation (X) 3-2 Emission from drying (X) 4-2 End-of-life management
(X) 1-3 Coating manufacturing (X) 2-3 Transportation to application site (X) 3-3 Necessary maintenance and repair  
Impacts per functional unit 1.15E-02 mPts 1.65E-03 mPts 1.65E-03 mPts 2.34E-04 mPts
Materials or processes contributing >20% to total impacts in each life cycle stage Polymer resins and solvent components, along with manufacturing processes such as blending, emulsifying, and packaging. Transportation of the product to the installation site. Emission from drying. Transport to waste facilities, background emissions from landfilling of coated concrete, and disposal of packaging waste.

Life cycle impact results per functional unit (Benicia, CA)

Life cycle stage Production Construction USE End of Life

Ecological damage

Impact category Unit
GWP, IPCC TOTAL kg CO2 eqKilograms of Carbon Dioxide equivalent
Global warming potential is an average increase in the temperature of the atmosphere near the Earth’s surface and in the troposphere, which can contribute to change in global climate patterns and is caused by the increase of the sources of greenhouse gases and decrease of the sinks due to deforestation and land use. GWP leads to problems in human health, agriculture, forest, water source, and damage to species and biodiversity as well as coastal areas. IPCCtotal is calculated based on IPCC 2013 AR5, inclusive of fossil and biogenic CO2eq.
3.07E-01 2.33E-02 2.40E-02 4.03E-03
GWP, IPCC BIOGENIC kg CO2 eqKilograms of Carbon Dioxide equivalent
Global warming is an average increase in the temperature of the atmosphere near the Earth’s surface and in the troposphere, which can contribute to change in global climate patterns and is caused by the increase of the sources of greenhouse gases and decrease of the sinks due to deforestation and land use. GW leads to problems in human health, agriculture, forest, water source, and damage to species and biodiversity as well as coastal areas. IPCCbiogenic reflects the biogenic carbon removals and emissions from products and packaging.
-5.60E-03 0.00E+00 5.60E-03 0.00E+00
GWP, IPCC FOSSIL kg CO2 eqKilograms of Carbon Dioxide equivalent
Global warming is an average increase in the temperature of the atmosphere near the Earth’s surface and in the troposphere, which can contribute to change in global climate patterns and is caused by the increase of the sources of greenhouse gases and decrease of the sinks due to deforestation and land use. GW leads to problems in human health, agriculture, forest, water source, and damage to species and biodiversity as well as coastal areas. IPCCfossil excludes effects from biogenic carbon.
3.12E-01 2.33E-02 1.84E-02 4.03E-03
GWP, TRACI 2.1 TOTAL kg CO2 eqKilograms of Carbon Dioxide equivalent
Global warming is an average increase in the temperature of the atmosphere near the Earth’s surface and in the troposphere, which can contribute to change in global climate patterns and is caused by the increase of the sources of greenhouse gases and decrease of the sinks due to deforestation and land use. GW leads to problems in human health, agriculture, forest, water source, and damage to species and biodiversity as well as coastal areas. The TRACI 2.1 total is the sum of TRACI 2.1 biogenic and TRACI 2.1 fossil results.
3.00E-01 2.31E-02 2.35E-02 3.72E-03
GWP, TRACI 2.1 BIOGENIC kg CO2 eqKilograms of Carbon Dioxide equivalent
Global warming is an average increase in the temperature of the atmosphere near the Earth’s surface and in the troposphere, which can contribute to change in global climate patterns and is caused by the increase of the sources of greenhouse gases and decrease of the sinks due to deforestation and land use. GW leads to problems in human health, agriculture, forest, water source, and damage to species and biodiversity as well as coastal areas. TRACI 2.1 biogenic results reflect the biogenic carbon removals and emissions from products and packaging.
-5.60E-03 0.00E+00 5.60E-03 0.00E+00
GWP, TRACI 2.1 FOSSIL kg CO2 eqKilograms of Carbon Dioxide equivalent
Global warming is an average increase in the temperature of the atmosphere near the Earth’s surface and in the troposphere, which can contribute to change in global climate patterns and is caused by the increase of the sources of greenhouse gases and decrease of the sinks due to deforestation and land use. GW leads to problems in human health, agriculture, forest, water source, and damage to species and biodiversity as well as coastal areas. The TRACI 2.1 fossil value reflects the default GWP value generated using the EPA methodology which excludes biogenic carbon by default.
3.05E-01 2.31E-02 1.79E-02 3.72E-03
Ozone depletion kg CFC-11 eq Kilograms of Trichlorofluoromethane equivalent
Ozone depletion is the reduction of ozone in the stratosphere caused by the release of ozone depleting chemicals. Ozone depletion can increases ultraviolet B radiation to the earth which can adversely affect human health (skin cancer and cataracts and immune-system suppression) and other systems (marine life, agricultural crops, and other vegetation) and causes damage to human-built materials.
5.27E-09 3.32E-10 2.52E-10 3.32E-11
Acidification kg SO2 eq Kilograms of Sulfur Dioxide equivalent
Acidification processes increase the acidity of water and soil systems and causes damage to lakes, streams, rivers, and various plants and animals, as well as building materials, paints, and other human-built structures.
8.99E-04 5.70E-05 5.90E-05 9.32E-06
Eutrophication kg N eqKilograms of Nitrogen equivalent
Eutrophication is the enrichment of an aquatic ecosystem with nutrients (nitrates and phosphates) that accelerate biological productivity (growth of algae and weeds) and an undesirable accumulation of algal biomass which impacts industry, agriculture, drinking, fishing, and recreation and causes death of fish and shellfish, toxicity to humans, marine mammals and livestock, and reduces biodiversity.
9.11E-05 3.88E-06 7.19E-06 9.30E-07

Life cycle impact results per functional unit (Cartersville, GA)

Life cycle stage Production Construction USE End of Life

Ecological damage

Impact category Unit
GWP, IPCC TOTAL kg CO2 eqKilograms of Carbon Dioxide equivalent
Global warming potential is an average increase in the temperature of the atmosphere near the Earth’s surface and in the troposphere, which can contribute to change in global climate patterns and is caused by the increase of the sources of greenhouse gases and decrease of the sinks due to deforestation and land use. GWP leads to problems in human health, agriculture, forest, water source, and damage to species and biodiversity as well as coastal areas. IPCCtotal is calculated based on IPCC 2013 AR5, inclusive of fossil and biogenic CO2eq.
1.90E-01 1.56E-02 2.40E-02 4.03E-03
GWP, IPCC BIOGENIC kg CO2 eqKilograms of Carbon Dioxide equivalent
Global warming is an average increase in the temperature of the atmosphere near the Earth’s surface and in the troposphere, which can contribute to change in global climate patterns and is caused by the increase of the sources of greenhouse gases and decrease of the sinks due to deforestation and land use. GW leads to problems in human health, agriculture, forest, water source, and damage to species and biodiversity as well as coastal areas. IPCCbiogenic reflects the biogenic carbon removals and emissions from products and packaging.
-5.60E-03 0.00E+00 5.60E-03 0.00E+00
GWP, IPCC FOSSIL kg CO2 eqKilograms of Carbon Dioxide equivalent
Global warming is an average increase in the temperature of the atmosphere near the Earth’s surface and in the troposphere, which can contribute to change in global climate patterns and is caused by the increase of the sources of greenhouse gases and decrease of the sinks due to deforestation and land use. GW leads to problems in human health, agriculture, forest, water source, and damage to species and biodiversity as well as coastal areas. IPCCfossil excludes effects from biogenic carbon.
1.95E-01 1.56E-02 1.84E-02 4.03E-03
GWP, TRACI 2.1 TOTAL kg CO2 eqKilograms of Carbon Dioxide equivalent
Global warming is an average increase in the temperature of the atmosphere near the Earth’s surface and in the troposphere, which can contribute to change in global climate patterns and is caused by the increase of the sources of greenhouse gases and decrease of the sinks due to deforestation and land use. GW leads to problems in human health, agriculture, forest, water source, and damage to species and biodiversity as well as coastal areas. The TRACI 2.1 total is the sum of TRACI 2.1 biogenic and TRACI 2.1 fossil results.
1.85E-01 1.55E-02 2.35E-02 3.72E-03
GWP, TRACI 2.1 BIOGENIC kg CO2 eqKilograms of Carbon Dioxide equivalent
Global warming is an average increase in the temperature of the atmosphere near the Earth’s surface and in the troposphere, which can contribute to change in global climate patterns and is caused by the increase of the sources of greenhouse gases and decrease of the sinks due to deforestation and land use. GW leads to problems in human health, agriculture, forest, water source, and damage to species and biodiversity as well as coastal areas. TRACI 2.1 biogenic results reflect the biogenic carbon removals and emissions from products and packaging.
-5.60E-03 0.00E+00 5.60E-03 0.00E+00
GWP, TRACI 2.1 FOSSIL kg CO2 eqKilograms of Carbon Dioxide equivalent
Global warming is an average increase in the temperature of the atmosphere near the Earth’s surface and in the troposphere, which can contribute to change in global climate patterns and is caused by the increase of the sources of greenhouse gases and decrease of the sinks due to deforestation and land use. GW leads to problems in human health, agriculture, forest, water source, and damage to species and biodiversity as well as coastal areas. The TRACI 2.1 fossil value reflects the default GWP value generated using the EPA methodology which excludes biogenic carbon by default.
1.90E-01 1.55E-02 1.79E-02 3.72E-03
Ozone depletion kg CFC-11 eq Kilograms of Trichlorofluoromethane equivalent
Ozone depletion is the reduction of ozone in the stratosphere caused by the release of ozone depleting chemicals. Ozone depletion can increases ultraviolet B radiation to the earth which can adversely affect human health (skin cancer and cataracts and immune-system suppression) and other systems (marine life, agricultural crops, and other vegetation) and causes damage to human-built materials.
2.66E-09 2.22E-10 2.52E-10 3.32E-11
Acidification kg SO2 eq Kilograms of Sulfur Dioxide equivalent
Acidification processes increase the acidity of water and soil systems and causes damage to lakes, streams, rivers, and various plants and animals, as well as building materials, paints, and other human-built structures.
6.17E-04 3.82E-05 5.90E-05 9.32E-06
Eutrophication kg N eqKilograms of Nitrogen equivalent
Eutrophication is the enrichment of an aquatic ecosystem with nutrients (nitrates and phosphates) that accelerate biological productivity (growth of algae and weeds) and an undesirable accumulation of algal biomass which impacts industry, agriculture, drinking, fishing, and recreation and causes death of fish and shellfish, toxicity to humans, marine mammals and livestock, and reduces biodiversity.
7.43E-05 2.59E-06 7.19E-06 9.30E-07

Life cycle impact results per functional unit (Fort Worth, TX)

Life cycle stage Production Construction USE End of Life

Ecological damage

Impact category Unit
GWP, IPCC TOTAL kg CO2 eqKilograms of Carbon Dioxide equivalent
Global warming potential is an average increase in the temperature of the atmosphere near the Earth’s surface and in the troposphere, which can contribute to change in global climate patterns and is caused by the increase of the sources of greenhouse gases and decrease of the sinks due to deforestation and land use. GWP leads to problems in human health, agriculture, forest, water source, and damage to species and biodiversity as well as coastal areas. IPCCtotal is calculated based on IPCC 2013 AR5, inclusive of fossil and biogenic CO2eq.
2.05E-01 1.88E-02 2.40E-02 4.03E-03
GWP, IPCC BIOGENIC kg CO2 eqKilograms of Carbon Dioxide equivalent
Global warming is an average increase in the temperature of the atmosphere near the Earth’s surface and in the troposphere, which can contribute to change in global climate patterns and is caused by the increase of the sources of greenhouse gases and decrease of the sinks due to deforestation and land use. GW leads to problems in human health, agriculture, forest, water source, and damage to species and biodiversity as well as coastal areas. IPCCbiogenic reflects the biogenic carbon removals and emissions from products and packaging.
-5.60E-03 0.00E+00 5.60E-03 0.00E+00
GWP, IPCC FOSSIL kg CO2 eqKilograms of Carbon Dioxide equivalent
Global warming is an average increase in the temperature of the atmosphere near the Earth’s surface and in the troposphere, which can contribute to change in global climate patterns and is caused by the increase of the sources of greenhouse gases and decrease of the sinks due to deforestation and land use. GW leads to problems in human health, agriculture, forest, water source, and damage to species and biodiversity as well as coastal areas. IPCCfossil excludes effects from biogenic carbon.
2.09E-01 1.88E-02 1.84E-02 4.03E-03
GWP, TRACI 2.1 TOTAL kg CO2 eqKilograms of Carbon Dioxide equivalent
Global warming is an average increase in the temperature of the atmosphere near the Earth’s surface and in the troposphere, which can contribute to change in global climate patterns and is caused by the increase of the sources of greenhouse gases and decrease of the sinks due to deforestation and land use. GW leads to problems in human health, agriculture, forest, water source, and damage to species and biodiversity as well as coastal areas. The TRACI 2.1 total is the sum of TRACI 2.1 biogenic and TRACI 2.1 fossil results.
2.00E-01 1.86E-02 2.35E-02 3.72E-03
GWP, TRACI 2.1 BIOGENIC kg CO2 eqKilograms of Carbon Dioxide equivalent
Global warming is an average increase in the temperature of the atmosphere near the Earth’s surface and in the troposphere, which can contribute to change in global climate patterns and is caused by the increase of the sources of greenhouse gases and decrease of the sinks due to deforestation and land use. GW leads to problems in human health, agriculture, forest, water source, and damage to species and biodiversity as well as coastal areas. TRACI 2.1 biogenic results reflect the biogenic carbon removals and emissions from products and packaging.
-5.60E-03 0.00E+00 5.60E-03 0.00E+00
GWP, TRACI 2.1 FOSSIL kg CO2 eqKilograms of Carbon Dioxide equivalent
Global warming is an average increase in the temperature of the atmosphere near the Earth’s surface and in the troposphere, which can contribute to change in global climate patterns and is caused by the increase of the sources of greenhouse gases and decrease of the sinks due to deforestation and land use. GW leads to problems in human health, agriculture, forest, water source, and damage to species and biodiversity as well as coastal areas. The TRACI 2.1 fossil value reflects the default GWP value generated using the EPA methodology which excludes biogenic carbon by default.
2.05E-01 1.86E-02 1.79E-02 3.72E-03
Ozone depletion kg CFC-11 eq Kilograms of Trichlorofluoromethane equivalent
Ozone depletion is the reduction of ozone in the stratosphere caused by the release of ozone depleting chemicals. Ozone depletion can increases ultraviolet B radiation to the earth which can adversely affect human health (skin cancer and cataracts and immune-system suppression) and other systems (marine life, agricultural crops, and other vegetation) and causes damage to human-built materials.
2.89E-09 2.67E-10 2.52E-10 3.32E-11
Acidification kg SO2 eq Kilograms of Sulfur Dioxide equivalent
Acidification processes increase the acidity of water and soil systems and causes damage to lakes, streams, rivers, and various plants and animals, as well as building materials, paints, and other human-built structures.
6.56E-04 4.59E-05 5.90E-05 9.32E-06
Eutrophication kg N eqKilograms of Nitrogen equivalent
Eutrophication is the enrichment of an aquatic ecosystem with nutrients (nitrates and phosphates) that accelerate biological productivity (growth of algae and weeds) and an undesirable accumulation of algal biomass which impacts industry, agriculture, drinking, fishing, and recreation and causes death of fish and shellfish, toxicity to humans, marine mammals and livestock, and reduces biodiversity.
7.65E-05 3.12E-06 7.19E-06 9.30E-07

Life cycle impact results per functional unit (Goodyear, AZ)

Life cycle stage Production Construction USE End of Life

Ecological damage

Impact category Unit
GWP, IPCC TOTAL kg CO2 eqKilograms of Carbon Dioxide equivalent
Global warming potential is an average increase in the temperature of the atmosphere near the Earth’s surface and in the troposphere, which can contribute to change in global climate patterns and is caused by the increase of the sources of greenhouse gases and decrease of the sinks due to deforestation and land use. GWP leads to problems in human health, agriculture, forest, water source, and damage to species and biodiversity as well as coastal areas. IPCCtotal is calculated based on IPCC 2013 AR5, inclusive of fossil and biogenic CO2eq.
2.23E-01 2.07E-02 2.40E-02 4.03E-03
GWP, IPCC BIOGENIC kg CO2 eqKilograms of Carbon Dioxide equivalent
Global warming is an average increase in the temperature of the atmosphere near the Earth’s surface and in the troposphere, which can contribute to change in global climate patterns and is caused by the increase of the sources of greenhouse gases and decrease of the sinks due to deforestation and land use. GW leads to problems in human health, agriculture, forest, water source, and damage to species and biodiversity as well as coastal areas. IPCCbiogenic reflects the biogenic carbon removals and emissions from products and packaging.
-5.60E-03 0.00E+00 5.60E-03 0.00E+00
GWP, IPCC FOSSIL kg CO2 eqKilograms of Carbon Dioxide equivalent
Global warming is an average increase in the temperature of the atmosphere near the Earth’s surface and in the troposphere, which can contribute to change in global climate patterns and is caused by the increase of the sources of greenhouse gases and decrease of the sinks due to deforestation and land use. GW leads to problems in human health, agriculture, forest, water source, and damage to species and biodiversity as well as coastal areas. IPCCfossil excludes effects from biogenic carbon.
2.28E-01 2.07E-02 1.84E-02 4.03E-03
GWP, TRACI 2.1 TOTAL kg CO2 eqKilograms of Carbon Dioxide equivalent
Global warming is an average increase in the temperature of the atmosphere near the Earth’s surface and in the troposphere, which can contribute to change in global climate patterns and is caused by the increase of the sources of greenhouse gases and decrease of the sinks due to deforestation and land use. GW leads to problems in human health, agriculture, forest, water source, and damage to species and biodiversity as well as coastal areas. The TRACI 2.1 total is the sum of TRACI 2.1 biogenic and TRACI 2.1 fossil results.
2.17E-01 2.05E-02 2.35E-02 3.72E-03
GWP, TRACI 2.1 BIOGENIC kg CO2 eqKilograms of Carbon Dioxide equivalent
Global warming is an average increase in the temperature of the atmosphere near the Earth’s surface and in the troposphere, which can contribute to change in global climate patterns and is caused by the increase of the sources of greenhouse gases and decrease of the sinks due to deforestation and land use. GW leads to problems in human health, agriculture, forest, water source, and damage to species and biodiversity as well as coastal areas. TRACI 2.1 biogenic results reflect the biogenic carbon removals and emissions from products and packaging.
-5.60E-03 0.00E+00 5.60E-03 0.00E+00
GWP, TRACI 2.1 FOSSIL kg CO2 eqKilograms of Carbon Dioxide equivalent
Global warming is an average increase in the temperature of the atmosphere near the Earth’s surface and in the troposphere, which can contribute to change in global climate patterns and is caused by the increase of the sources of greenhouse gases and decrease of the sinks due to deforestation and land use. GW leads to problems in human health, agriculture, forest, water source, and damage to species and biodiversity as well as coastal areas. The TRACI 2.1 fossil value reflects the default GWP value generated using the EPA methodology which excludes biogenic carbon by default.
2.22E-01 2.05E-02 1.79E-02 3.72E-03
Ozone depletion kg CFC-11 eq Kilograms of Trichlorofluoromethane equivalent
Ozone depletion is the reduction of ozone in the stratosphere caused by the release of ozone depleting chemicals. Ozone depletion can increases ultraviolet B radiation to the earth which can adversely affect human health (skin cancer and cataracts and immune-system suppression) and other systems (marine life, agricultural crops, and other vegetation) and causes damage to human-built materials.
3.50E-09 2.95E-10 2.52E-10 3.32E-11
Acidification kg SO2 eq Kilograms of Sulfur Dioxide equivalent
Acidification processes increase the acidity of water and soil systems and causes damage to lakes, streams, rivers, and various plants and animals, as well as building materials, paints, and other human-built structures.
7.07E-04 5.07E-05 5.90E-05 9.32E-06
Eutrophication kg N eqKilograms of Nitrogen equivalent
Eutrophication is the enrichment of an aquatic ecosystem with nutrients (nitrates and phosphates) that accelerate biological productivity (growth of algae and weeds) and an undesirable accumulation of algal biomass which impacts industry, agriculture, drinking, fishing, and recreation and causes death of fish and shellfish, toxicity to humans, marine mammals and livestock, and reduces biodiversity.
8.07E-05 3.44E-06 7.19E-06 9.30E-07

Life cycle impact results per functional unit (Hampshire, IL)

Life cycle stage Production Construction USE End of Life

Ecological damage

Impact category Unit
GWP, IPCC TOTAL kg CO2 eqKilograms of Carbon Dioxide equivalent
Global warming potential is an average increase in the temperature of the atmosphere near the Earth’s surface and in the troposphere, which can contribute to change in global climate patterns and is caused by the increase of the sources of greenhouse gases and decrease of the sinks due to deforestation and land use. GWP leads to problems in human health, agriculture, forest, water source, and damage to species and biodiversity as well as coastal areas. IPCCtotal is calculated based on IPCC 2013 AR5, inclusive of fossil and biogenic CO2eq.
1.94E-01 2.13E-02 2.40E-02 4.03E-03
GWP, IPCC BIOGENIC kg CO2 eqKilograms of Carbon Dioxide equivalent
Global warming is an average increase in the temperature of the atmosphere near the Earth’s surface and in the troposphere, which can contribute to change in global climate patterns and is caused by the increase of the sources of greenhouse gases and decrease of the sinks due to deforestation and land use. GW leads to problems in human health, agriculture, forest, water source, and damage to species and biodiversity as well as coastal areas. IPCCbiogenic reflects the biogenic carbon removals and emissions from products and packaging.
-5.60E-03 0.00E+00 5.60E-03 0.00E+00
GWP, IPCC FOSSIL kg CO2 eqKilograms of Carbon Dioxide equivalent
Global warming is an average increase in the temperature of the atmosphere near the Earth’s surface and in the troposphere, which can contribute to change in global climate patterns and is caused by the increase of the sources of greenhouse gases and decrease of the sinks due to deforestation and land use. GW leads to problems in human health, agriculture, forest, water source, and damage to species and biodiversity as well as coastal areas. IPCCfossil excludes effects from biogenic carbon.
1.98E-01 2.13E-02 1.84E-02 4.03E-03
GWP, TRACI 2.1 TOTAL kg CO2 eqKilograms of Carbon Dioxide equivalent
Global warming is an average increase in the temperature of the atmosphere near the Earth’s surface and in the troposphere, which can contribute to change in global climate patterns and is caused by the increase of the sources of greenhouse gases and decrease of the sinks due to deforestation and land use. GW leads to problems in human health, agriculture, forest, water source, and damage to species and biodiversity as well as coastal areas. The TRACI 2.1 total is the sum of TRACI 2.1 biogenic and TRACI 2.1 fossil results.
1.89E-01 2.11E-02 2.35E-02 3.72E-03
GWP, TRACI 2.1 BIOGENIC kg CO2 eqKilograms of Carbon Dioxide equivalent
Global warming is an average increase in the temperature of the atmosphere near the Earth’s surface and in the troposphere, which can contribute to change in global climate patterns and is caused by the increase of the sources of greenhouse gases and decrease of the sinks due to deforestation and land use. GW leads to problems in human health, agriculture, forest, water source, and damage to species and biodiversity as well as coastal areas. TRACI 2.1 biogenic results reflect the biogenic carbon removals and emissions from products and packaging.
-5.60E-03 0.00E+00 5.60E-03 0.00E+00
GWP, TRACI 2.1 FOSSIL kg CO2 eqKilograms of Carbon Dioxide equivalent
Global warming is an average increase in the temperature of the atmosphere near the Earth’s surface and in the troposphere, which can contribute to change in global climate patterns and is caused by the increase of the sources of greenhouse gases and decrease of the sinks due to deforestation and land use. GW leads to problems in human health, agriculture, forest, water source, and damage to species and biodiversity as well as coastal areas. The TRACI 2.1 fossil value reflects the default GWP value generated using the EPA methodology which excludes biogenic carbon by default.
1.94E-01 2.11E-02 1.79E-02 3.72E-03
Ozone depletion kg CFC-11 eq Kilograms of Trichlorofluoromethane equivalent
Ozone depletion is the reduction of ozone in the stratosphere caused by the release of ozone depleting chemicals. Ozone depletion can increases ultraviolet B radiation to the earth which can adversely affect human health (skin cancer and cataracts and immune-system suppression) and other systems (marine life, agricultural crops, and other vegetation) and causes damage to human-built materials.
2.91E-09 3.03E-10 2.52E-10 3.32E-11
Acidification kg SO2 eq Kilograms of Sulfur Dioxide equivalent
Acidification processes increase the acidity of water and soil systems and causes damage to lakes, streams, rivers, and various plants and animals, as well as building materials, paints, and other human-built structures.
6.39E-04 5.22E-05 5.90E-05 9.32E-06
Eutrophication kg N eqKilograms of Nitrogen equivalent
Eutrophication is the enrichment of an aquatic ecosystem with nutrients (nitrates and phosphates) that accelerate biological productivity (growth of algae and weeds) and an undesirable accumulation of algal biomass which impacts industry, agriculture, drinking, fishing, and recreation and causes death of fish and shellfish, toxicity to humans, marine mammals and livestock, and reduces biodiversity.
7.57E-05 3.54E-06 7.19E-06 9.30E-07

Life cycle impact results per functional unit (York, PA)

Life cycle stage Production Construction USE End of Life

Ecological damage

Impact category Unit
GWP, IPCC TOTAL kg CO2 eqKilograms of Carbon Dioxide equivalent
Global warming potential is an average increase in the temperature of the atmosphere near the Earth’s surface and in the troposphere, which can contribute to change in global climate patterns and is caused by the increase of the sources of greenhouse gases and decrease of the sinks due to deforestation and land use. GWP leads to problems in human health, agriculture, forest, water source, and damage to species and biodiversity as well as coastal areas. IPCCtotal is calculated based on IPCC 2013 AR5, inclusive of fossil and biogenic CO2eq.
2.00E-01 1.68E-02 2.40E-02 4.03E-03
GWP, IPCC BIOGENIC kg CO2 eqKilograms of Carbon Dioxide equivalent
Global warming is an average increase in the temperature of the atmosphere near the Earth’s surface and in the troposphere, which can contribute to change in global climate patterns and is caused by the increase of the sources of greenhouse gases and decrease of the sinks due to deforestation and land use. GW leads to problems in human health, agriculture, forest, water source, and damage to species and biodiversity as well as coastal areas. IPCCbiogenic reflects the biogenic carbon removals and emissions from products and packaging.
-5.60E-03 0.00E+00 5.60E-03 0.00E+00
GWP, IPCC FOSSIL kg CO2 eqKilograms of Carbon Dioxide equivalent
Global warming is an average increase in the temperature of the atmosphere near the Earth’s surface and in the troposphere, which can contribute to change in global climate patterns and is caused by the increase of the sources of greenhouse gases and decrease of the sinks due to deforestation and land use. GW leads to problems in human health, agriculture, forest, water source, and damage to species and biodiversity as well as coastal areas. IPCCfossil excludes effects from biogenic carbon.
2.05E-01 1.68E-02 1.84E-02 4.03E-03
GWP, TRACI 2.1 TOTAL kg CO2 eqKilograms of Carbon Dioxide equivalent
Global warming is an average increase in the temperature of the atmosphere near the Earth’s surface and in the troposphere, which can contribute to change in global climate patterns and is caused by the increase of the sources of greenhouse gases and decrease of the sinks due to deforestation and land use. GW leads to problems in human health, agriculture, forest, water source, and damage to species and biodiversity as well as coastal areas. The TRACI 2.1 total is the sum of TRACI 2.1 biogenic and TRACI 2.1 fossil results.
1.95E-01 1.67E-02 2.35E-02 3.72E-03
GWP, TRACI 2.1 BIOGENIC kg CO2 eqKilograms of Carbon Dioxide equivalent
Global warming is an average increase in the temperature of the atmosphere near the Earth’s surface and in the troposphere, which can contribute to change in global climate patterns and is caused by the increase of the sources of greenhouse gases and decrease of the sinks due to deforestation and land use. GW leads to problems in human health, agriculture, forest, water source, and damage to species and biodiversity as well as coastal areas. TRACI 2.1 biogenic results reflect the biogenic carbon removals and emissions from products and packaging.
-5.60E-03 0.00E+00 5.60E-03 0.00E+00
GWP, TRACI 2.1 FOSSIL kg CO2 eqKilograms of Carbon Dioxide equivalent
Global warming is an average increase in the temperature of the atmosphere near the Earth’s surface and in the troposphere, which can contribute to change in global climate patterns and is caused by the increase of the sources of greenhouse gases and decrease of the sinks due to deforestation and land use. GW leads to problems in human health, agriculture, forest, water source, and damage to species and biodiversity as well as coastal areas. The TRACI 2.1 fossil value reflects the default GWP value generated using the EPA methodology which excludes biogenic carbon by default.
2.00E-01 1.67E-02 1.79E-02 3.72E-03
Ozone depletion kg CFC-11 eq Kilograms of Trichlorofluoromethane equivalent
Ozone depletion is the reduction of ozone in the stratosphere caused by the release of ozone depleting chemicals. Ozone depletion can increases ultraviolet B radiation to the earth which can adversely affect human health (skin cancer and cataracts and immune-system suppression) and other systems (marine life, agricultural crops, and other vegetation) and causes damage to human-built materials.
3.03E-09 2.39E-10 2.52E-10 3.32E-11
Acidification kg SO2 eq Kilograms of Sulfur Dioxide equivalent
Acidification processes increase the acidity of water and soil systems and causes damage to lakes, streams, rivers, and various plants and animals, as well as building materials, paints, and other human-built structures.
6.56E-04 4.12E-05 5.90E-05 9.32E-06
Eutrophication kg N eqKilograms of Nitrogen equivalent
Eutrophication is the enrichment of an aquatic ecosystem with nutrients (nitrates and phosphates) that accelerate biological productivity (growth of algae and weeds) and an undesirable accumulation of algal biomass which impacts industry, agriculture, drinking, fishing, and recreation and causes death of fish and shellfish, toxicity to humans, marine mammals and livestock, and reduces biodiversity.
7.69E-05 2.80E-06 7.19E-06 9.30E-07

Life cycle impact results per functional unit (Milton, Ontario, Canada)

Life cycle stage Production Construction USE End of Life

Ecological damage

Impact category Unit
GWP, IPCC TOTAL kg CO2 eqKilograms of Carbon Dioxide equivalent
Global warming potential is an average increase in the temperature of the atmosphere near the Earth’s surface and in the troposphere, which can contribute to change in global climate patterns and is caused by the increase of the sources of greenhouse gases and decrease of the sinks due to deforestation and land use. GWP leads to problems in human health, agriculture, forest, water source, and damage to species and biodiversity as well as coastal areas. IPCCtotal is calculated based on IPCC 2013 AR5, inclusive of fossil and biogenic CO2eq.
2.04E-01 1.01E-01 2.40E-02 4.03E-03
GWP, IPCC BIOGENIC kg CO2 eqKilograms of Carbon Dioxide equivalent
Global warming is an average increase in the temperature of the atmosphere near the Earth’s surface and in the troposphere, which can contribute to change in global climate patterns and is caused by the increase of the sources of greenhouse gases and decrease of the sinks due to deforestation and land use. GW leads to problems in human health, agriculture, forest, water source, and damage to species and biodiversity as well as coastal areas. IPCCbiogenic reflects the biogenic carbon removals and emissions from products and packaging.
-5.60E-03 0.00E+00 5.60E-03 0.00E+00
GWP, IPCC FOSSIL kg CO2 eqKilograms of Carbon Dioxide equivalent
Global warming is an average increase in the temperature of the atmosphere near the Earth’s surface and in the troposphere, which can contribute to change in global climate patterns and is caused by the increase of the sources of greenhouse gases and decrease of the sinks due to deforestation and land use. GW leads to problems in human health, agriculture, forest, water source, and damage to species and biodiversity as well as coastal areas. IPCCfossil excludes effects from biogenic carbon.
2.09E-01 1.01E-01 1.84E-02 4.03E-03
GWP, TRACI 2.1 TOTAL kg CO2 eqKilograms of Carbon Dioxide equivalent
Global warming is an average increase in the temperature of the atmosphere near the Earth’s surface and in the troposphere, which can contribute to change in global climate patterns and is caused by the increase of the sources of greenhouse gases and decrease of the sinks due to deforestation and land use. GW leads to problems in human health, agriculture, forest, water source, and damage to species and biodiversity as well as coastal areas. The TRACI 2.1 total is the sum of TRACI 2.1 biogenic and TRACI 2.1 fossil results.
1.99E-01 1.00E-01 2.35E-02 3.72E-03
GWP, TRACI 2.1 BIOGENIC kg CO2 eqKilograms of Carbon Dioxide equivalent
Global warming is an average increase in the temperature of the atmosphere near the Earth’s surface and in the troposphere, which can contribute to change in global climate patterns and is caused by the increase of the sources of greenhouse gases and decrease of the sinks due to deforestation and land use. GW leads to problems in human health, agriculture, forest, water source, and damage to species and biodiversity as well as coastal areas. TRACI 2.1 biogenic results reflect the biogenic carbon removals and emissions from products and packaging.
-5.60E-03 0.00E+00 5.60E-03 0.00E+00
GWP, TRACI 2.1 FOSSIL kg CO2 eqKilograms of Carbon Dioxide equivalent
Global warming is an average increase in the temperature of the atmosphere near the Earth’s surface and in the troposphere, which can contribute to change in global climate patterns and is caused by the increase of the sources of greenhouse gases and decrease of the sinks due to deforestation and land use. GW leads to problems in human health, agriculture, forest, water source, and damage to species and biodiversity as well as coastal areas. The TRACI 2.1 fossil value reflects the default GWP value generated using the EPA methodology which excludes biogenic carbon by default.
2.04E-01 1.00E-01 1.79E-02 3.72E-03
Ozone depletion kg CFC-11 eq Kilograms of Trichlorofluoromethane equivalent
Ozone depletion is the reduction of ozone in the stratosphere caused by the release of ozone depleting chemicals. Ozone depletion can increases ultraviolet B radiation to the earth which can adversely affect human health (skin cancer and cataracts and immune-system suppression) and other systems (marine life, agricultural crops, and other vegetation) and causes damage to human-built materials.
2.86E-09 1.73E-09 2.52E-10 3.32E-11
Acidification kg SO2 eq Kilograms of Sulfur Dioxide equivalent
Acidification processes increase the acidity of water and soil systems and causes damage to lakes, streams, rivers, and various plants and animals, as well as building materials, paints, and other human-built structures.
6.53E-04 2.19E-04 5.90E-05 9.32E-06
Eutrophication kg N eqKilograms of Nitrogen equivalent
Eutrophication is the enrichment of an aquatic ecosystem with nutrients (nitrates and phosphates) that accelerate biological productivity (growth of algae and weeds) and an undesirable accumulation of algal biomass which impacts industry, agriculture, drinking, fishing, and recreation and causes death of fish and shellfish, toxicity to humans, marine mammals and livestock, and reduces biodiversity.
7.62E-05 1.46E-05 7.19E-06 9.30E-07

Life cycle impact results per functional unit (Sherwood, Alberta, Canada)

Life cycle stage Production Construction USE End of Life

Ecological damage

Impact category Unit
GWP, IPCC TOTAL kg CO2 eqKilograms of Carbon Dioxide equivalent
Global warming potential is an average increase in the temperature of the atmosphere near the Earth’s surface and in the troposphere, which can contribute to change in global climate patterns and is caused by the increase of the sources of greenhouse gases and decrease of the sinks due to deforestation and land use. GWP leads to problems in human health, agriculture, forest, water source, and damage to species and biodiversity as well as coastal areas. IPCCtotal is calculated based on IPCC 2013 AR5, inclusive of fossil and biogenic CO2eq.
2.21E-01 2.12E-02 2.40E-02 4.03E-03
GWP, IPCC BIOGENIC kg CO2 eqKilograms of Carbon Dioxide equivalent
Global warming is an average increase in the temperature of the atmosphere near the Earth’s surface and in the troposphere, which can contribute to change in global climate patterns and is caused by the increase of the sources of greenhouse gases and decrease of the sinks due to deforestation and land use. GW leads to problems in human health, agriculture, forest, water source, and damage to species and biodiversity as well as coastal areas. IPCCbiogenic reflects the biogenic carbon removals and emissions from products and packaging.
-5.60E-03 0.00E+00 5.60E-03 0.00E+00
GWP, IPCC FOSSIL kg CO2 eqKilograms of Carbon Dioxide equivalent
Global warming is an average increase in the temperature of the atmosphere near the Earth’s surface and in the troposphere, which can contribute to change in global climate patterns and is caused by the increase of the sources of greenhouse gases and decrease of the sinks due to deforestation and land use. GW leads to problems in human health, agriculture, forest, water source, and damage to species and biodiversity as well as coastal areas. IPCCfossil excludes effects from biogenic carbon.
2.26E-01 2.12E-02 1.84E-02 4.03E-03
GWP, TRACI 2.1 TOTAL kg CO2 eqKilograms of Carbon Dioxide equivalent
Global warming is an average increase in the temperature of the atmosphere near the Earth’s surface and in the troposphere, which can contribute to change in global climate patterns and is caused by the increase of the sources of greenhouse gases and decrease of the sinks due to deforestation and land use. GW leads to problems in human health, agriculture, forest, water source, and damage to species and biodiversity as well as coastal areas. The TRACI 2.1 total is the sum of TRACI 2.1 biogenic and TRACI 2.1 fossil results.
2.16E-01 2.10E-02 2.35E-02 3.72E-03
GWP, TRACI 2.1 BIOGENIC kg CO2 eqKilograms of Carbon Dioxide equivalent
Global warming is an average increase in the temperature of the atmosphere near the Earth’s surface and in the troposphere, which can contribute to change in global climate patterns and is caused by the increase of the sources of greenhouse gases and decrease of the sinks due to deforestation and land use. GW leads to problems in human health, agriculture, forest, water source, and damage to species and biodiversity as well as coastal areas. TRACI 2.1 biogenic results reflect the biogenic carbon removals and emissions from products and packaging.
-5.60E-03 0.00E+00 5.60E-03 0.00E+00
GWP, TRACI 2.1 FOSSIL kg CO2 eqKilograms of Carbon Dioxide equivalent
Global warming is an average increase in the temperature of the atmosphere near the Earth’s surface and in the troposphere, which can contribute to change in global climate patterns and is caused by the increase of the sources of greenhouse gases and decrease of the sinks due to deforestation and land use. GW leads to problems in human health, agriculture, forest, water source, and damage to species and biodiversity as well as coastal areas. The TRACI 2.1 fossil value reflects the default GWP value generated using the EPA methodology which excludes biogenic carbon by default.
2.21E-01 2.10E-02 1.79E-02 3.72E-03
Ozone depletion kg CFC-11 eq Kilograms of Trichlorofluoromethane equivalent
Ozone depletion is the reduction of ozone in the stratosphere caused by the release of ozone depleting chemicals. Ozone depletion can increases ultraviolet B radiation to the earth which can adversely affect human health (skin cancer and cataracts and immune-system suppression) and other systems (marine life, agricultural crops, and other vegetation) and causes damage to human-built materials.
3.07E-09 3.02E-10 2.52E-10 3.32E-11
Acidification kg SO2 eq Kilograms of Sulfur Dioxide equivalent
Acidification processes increase the acidity of water and soil systems and causes damage to lakes, streams, rivers, and various plants and animals, as well as building materials, paints, and other human-built structures.
7.34E-04 5.19E-05 5.90E-05 9.32E-06
Eutrophication kg N eqKilograms of Nitrogen equivalent
Eutrophication is the enrichment of an aquatic ecosystem with nutrients (nitrates and phosphates) that accelerate biological productivity (growth of algae and weeds) and an undesirable accumulation of algal biomass which impacts industry, agriculture, drinking, fishing, and recreation and causes death of fish and shellfish, toxicity to humans, marine mammals and livestock, and reduces biodiversity.
8.40E-05 3.53E-06 7.19E-06 9.30E-07

References

LCA Background Report
LCA of W. R. MEADOWS Concrete curing products, 2025. Developed using the IPCC Fifth Assessment Report (AR5) 100-year time, TRACI v2.1, CML, and Cumulative Energy Demand (LHV) impact assessment methodologies, SimaPro Analyst 9.6 software, and ecoinvent v3.10 and US-EI 2.2 databases.

ISO 14025:2006 Environmental labels and declarations — Type III environmental declarations — Principles and procedures

ISO 21930:2017, Sustainability in buildings and civil engineering works -- Core rules for environmental product declarations of construction products and services

NSF Product Category Rule for Environmental Product Declarations: Architectural Coatings: NAICS 325510, version 2 extended through June 30, 2025.

Download VOCOMP®-25 PDF SM Transparency Report [EPD]

SM Transparency Reports (TR) are ISO 14025 Type III environmental declarations (EPD) that enable purchasers and users to compare the potential environmental performance of products on a life cycle basis. Environmental declarations from different programs (ISO 14025) may not be comparable. Comparison of the environmental performance using EPD information shall consider all relevant information modules over the full life cycle of the products within the building. This PCR allows EPD comparability only when the same functional requirements between products are ensured and the requirements of ISO 21930:2017 §5.5 are met. It should be noted that different LCA software and background LCI datasets may lead to differences results for upstream or downstream of the life cycle stages declared. LCIA results are relative expressions and do not predict impacts on category endpoints, the exceeding of thresholds, safety margins or risks. These six impact categories are globally deemed mature enough to be included in Type III environmental declarations. Other categories are being developed and defined and LCA should continue making advances in their development. However, the EPD users shall not use additional measures for comparative purposes. Comparison of the environmental performance of structural and architectural wood products using EPD information shall be based on the product’s use and impacts at the construction works level, and therefore EPDs may not be used for comparability purposes when not considering the construction works energy use phase as instructed under this PCR. Full conformance with the PCR for structural and architectural wood products allows EPD comparability only when all stages of a life cycle have been considered, when they comply with all referenced standards, use the same sub-category Part B PCR, and use equivalent scenarios with respect to construction works. However, variations and deviations are possible. Example of variations: Different LCA software and background LCI datasets may lead to differences results for upstream or downstream of the life cycle stages declared.

Rating systems

The intent is to reward project teams for selecting products from manufacturers who have verified life-cycle environmental performance.

LEED BD+C: New Construction | v4 - LEED v4

Building product disclosure and optimization

Environmental product declarations

  • Industry-wide (generic) EPD ½ product

  • Product-specific Type III EPD 1 product

LEED BD+C: New Construction | v4.1 - LEED v4.1

Building product disclosure and optimization

Environmental product declarations

  • Industry-wide (generic) EPD 1 product

  • Product-specific Type III EPD 1.5 products

Green Globes for New Construction and Sustainable Interiors

Materials and resources

  • NC 3.5.1.2 Path B: Prescriptive Path for Building Core and Shell

  • NC 3.5.2.2 and SI 4.1.2 Path B: Prescriptive Path for Interior Fit-outs

BREEAM New Construction 2018

Mat 02 - Environmental impacts from construction products

Environmental Product Declarations (EPD)

  • Industry-average EPD .5 points

  • Multi-product specific EPD .75 points

  • Product-specific EPD 1 point