
LCA results & interpretation X-Series: Panelized Exterior Wall Systems
Scope and summary
- Cradle to gate
- Cradle to gate with options
- Cradle to grave
Scope description
The scope of the study is cradle-to-gate with options and includes production, transport to the building site, installation, and end-of-life (A1-A5 and C1-C4).
Application
The X-Series MCM system is a factory-assembled rainscreen system with fire-retardant core metal composite material (MCM), also known as aluminum composite material (ACM). The cold-formed steel frame provides structural strength and dimensional stability, ensuring precise integration with the building structure. Exterior gypsum sheathing adds a rigid, fire-resistant substrate and structural support, while the air & water resistive barrier prevents air infiltration and water intrusion to protect the building envelope and improve energy performance. Z-girts create a secure structural attachment point for both insulation and panels, while also facilitating effective water drainage and ventilation within the wall assembly. In certain designs, a hat channel is added to enhance structural support, improve ventilation, and ensure precise panel alignment. The exterior finish layer features aluminum composite material panels that deliver superior weather resistance, long-term durability, and a modern, high-end architectural appearance.
Declared unit
An installed prefabricated exterior wall panel assembly which covers 400 square feet of a building. All fasteners, clips, brackets, sealants, gaskets, and adhesives necessary to ensure the specified function are included. For the optional disclosure of panels with openings, all associated infill components are installed at the DBC facility, and their impacts are included in the results.
This study considers 2.6 panels per declared unit, with a typical panel size of 3.02 x 4.72 m at a typical thickness of 0.295 m, having a density of 437 kg/m3 and RSI of 42.4 m2K/W. The minimum and maximum spans available for the panel are 1.22 x 3.05 m to 4.11 x 10.7 m. The mass of panels per declared unit is 1,841 kg. The anticipated reference service life is 75 years. For panels with openings, 15.1% of the area is openings, and the RSI of windows filling those designated openings is 1.23 m2K/W.
Production
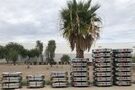
Raw materials and components were sourced from single suppliers, and supplier locations were used to model distances and transport modes to the facility. Those components are assembled on site. DBC operates on-site solar panels connected to the electricity grid, with the solar contribution ranging from 32% to 54%. A portion of the facility’s energy demand is met by solar generation, while the remainder is supplied from the grid. The finished panel systems are packaged into bunks, with wood blocks to stabilize and elevate the load, cardboard corner guards to protect edges from impact and abrasion, packing foam to cushion and reduce vibration during transport, shrink wrap to secure and consolidate the load, and plywood boards to provide structure and protect against puncture or compression.
Construction and end of life
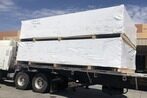
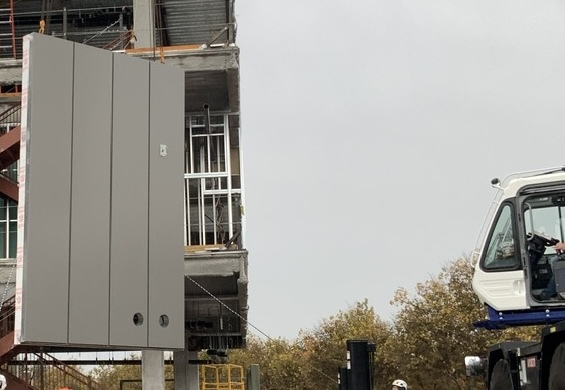
Packaged exterior wall panel systems are assumed to be shipped 1,315 km by diesel-powered truck from the manufacturing facility to the job site. The panels are moved and lifted into place by diesel-powered cranes, with diesel consumption of 10.3 liters per declared unit. Backer rods, silicone sealant, cement board, clips, connectors, and fasteners are used to secure the panels and panel joint enclosures. Shrink wrap is transported 32.2 km to landfill, while other packaging materials including cardboard guards, plywood board, packing foam, and wood blocks are returned to DBC for reuse. Since panels are fabricated to the design, no installation scrap is generated. At the end of life, products are transported 32.2 km by diesel-powered trucks to a construction or inert waste landfill.
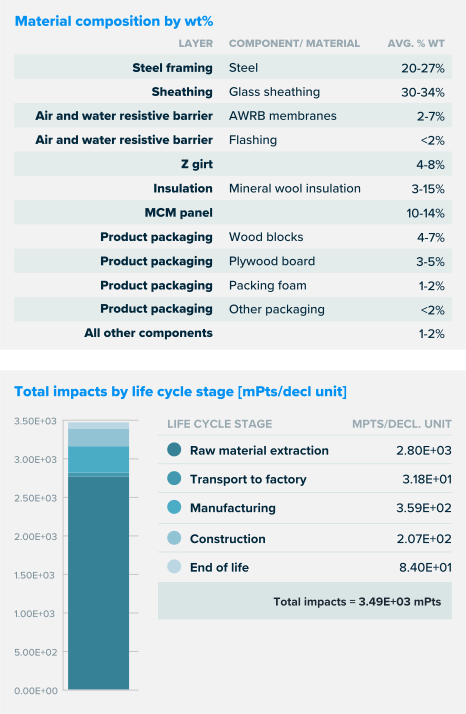
What’s causing the greatest impacts
All life cycle stages
The production stage dominates the results across all impact categories making up more than 75% of total impacts. Within these cradle-to-gate modules, raw material extraction and upstream production of wall system components supplied to the DBC facility accounted for the largest share of impacts in all categories. Although other life cycle modules also contributed, their influence was relatively minor compared to the cradle-to-gate impacts. Beyond the gate, the next most significant stages were product distribution and installation. End-of-life processes related to dismantling and final waste treatment also had noticeable contributions, particularly in smog formation, non-carcinogenic effects, and ecotoxicity.
Production stage
Raw material extraction and upstream processing (A1) and manufacturing (A3) are the most impactful modules in the product life cycle. A look at the GWP per each layer of the system shows that more than half of the results are attributed to cold-formed steel framing, while the other layers collectively accounted for the remainder. This trend was consistent across other impact categories. Electricity consumption dominated the results for manufacturing operations (A3). Additional contributors to manufacturing included landfilling of manufacturing waste and the sourcing of packaging materials for final product packaging. Transportation of materials and components to the manufacturing facility (A2) contributes minimally to the results.
Construction stage
Installation (A5) activities dominate impacts in the construction stage across about half of impact categories, especially smog, carcinogenics, and freshwater eutrophication. These potential impacts are primarily attributed to the use of ancillary materials such as panel attachment materials, sealants, and fasteners, as well as the energy required to lift and position panels during installation. Product distribution (A4) impacts come from the transportation between the manufacturing facility and the installation site.
End-of-life stage
The transportation to landfill (C2) is the dominant contributor to most impact categories except ecotoxicity, freshwater eutrophication, carcinogenics, and non-carcinogenics. Potential transportation impacts were particularly notable for smog formation, driven by emissions during waste transport to disposal. Landfilling of products at the end of life during waste disposal (C4) largely contributed to the non-carcinogenics and ecotoxicity impact categories. Demolition (C1) and waste processing (C3) are assumed to be negligible.
Sensitivity analysis
Sensitivity analyses were performed to evaluate the robustness of the results, focusing on parameters contributing most significantly to the environmental impacts. Two parameters under DBC’s direct control were selected for testing: share of solar energy in the DBC facility’s electricity mix, and the waste management practices applied to manufacturing waste.
DBC currently operates on-site solar panels that supply a portion of its electricity demand. Changing the share of solar power significantly affects impacts in module A3 but has only a minor influence on the overall life cycle. The largest changes occur in global warming potential, ozone depletion, and acidification, where electricity use dominates, while impacts such as ecotoxicity and eutrophication are less sensitive because they are driven more by factors like waste management. Global warming, ozone depletion, and acidification demonstrate the potential to exceed a 20% change in A3 impacts.
Altering waste management practices strongly affects impacts in module A3 and leads to noticeable changes in overall life cycle results. The effect is most pronounced for ecotoxicity and freshwater eutrophication, where landfilling is a dominant contributor to A3 impacts. In contrast, global warming potential (GWP) and ozone depletion are less sensitive to waste management changes, as they are driven primarily by other factors such as electricity consumption. Non carcinogenics, ecotoxicity, and freshwater eutrophication each show the potential for more than a 20% change in A3 impacts, with corresponding impacts also exceeding 20% across the overall life cycle.
Overall, some impact categories respond more to variations in electricity sourcing or waste management, but the contribution of those variations to the total results, in most impact categories, was minimal.
Manufacturing data
Reporting period: January 2023 through August 2024
Location: Phoenix, AZ
Embodied carbon
Embodied carbon can be defined as the cradle-to-gate (A1-A3) global warming potential impacts. The total embodied carbon per declared unit of X-Series MCM is 3.46E+03 kg CO2-eq.
How we're making it greener
DBC’s panelized exterior wall systems are designed for maximum thermal efficiency, reduced structural impact, optimized energy use, and minimal material waste, directly supporting sustainable construction goals. By leveraging custom framing software that communicates directly with our roll former, DBC ensures framing components are cut to precise dimensions, virtually eliminating material waste. Materials are fabricated and procured to custom lengths, further reducing waste compared to traditional methods.
Additionally, DBC’s prefabrication approach shortens on-site installation time and requires smaller crews of 5–6 workers, resulting in lowered carbon emissions compared to conventional construction, while delivering a more environmentally responsible and efficient building solution.
LCA results
| Life cycle stage | Raw material extraction | Transport | Manufacturing | Construction | End of life |
|
Information modules: |
(X) A1 Raw material extraction | (X) A2 Transport to factory | (X) A3 Manufacturing | (X) A4 Delivery | (X) C1 Demolition |
| (X) A5 Installation | (X) C2 Transportation | ||||
| (X) C3 Waste processing | |||||
| (X) C4 Disposal | |||||
 |
 |
 |
 |
 |
SM Single Score
Learn about SM Single Score results| Impacts per declared unit | 2.80E+03 mPts | 3.18E+01 mPts | 3.59E+02 mPts | 2.07E+02 mPts | 8.40E+01 mPts |
| Materials or processes contributing >20% to total impacts in each life cycle stage | Material sourcing and upstream production of wall system components. | Transportation of the components to the manufacturing facility. | Use of electricity in the manufacturing facility. | Transportation of the product to installation sites and use of ancillary materials during installation. | Transport to waste processing and disposal of material flows transported to a landfill. |
TRACI v2.2 results per declared unit
| Life cycle stage | Raw material extraction | Transport | Manufacturing | Construction | End of Life |
Ecological damage
Human health damage
Additional environmental information
| Impact category | Unit | |||||
| Carcinogenics | CTUh Comparative Toxic Units of Human cancerous toxicity Carcinogens have the potential to form cancers in humans. |
1.29E-03 | 6.87E-06 | 2.38E-05 | 7.12E-05 | 4.43E-06 |
| Non-carcinogenics | CTUh Comparative Toxic Units of Human non-cancerous toxicity Non-Carcinogens have the potential to causes non-cancerous adverse impacts to human health. |
5.72E-04 | 4.29E-05 | 5.36E-04 | 1.31E-04 | 2.26E-04 |
| Ecotoxicity | CTUe Comparative Toxic Units of Ecotoxicity Ecotoxicity causes negative impacts to ecological receptors and, indirectly, to human receptors through the impacts to the ecosystem. |
3.16E+04 | 9.77E+02 | 3.20E+04 | 4.82E+03 | 7.56E+03 |
References
LCA Background Report
Life Cycle Assessment of X-Series: Panelized Exterior Wall Systems, DBC 2025; SimaPro Craft 10.2; ecoinvent and Industry data 2.0 databases; TRACI 2.2.
ISO 14025, “Sustainability in buildings and civil engineering works — Core rules for environmental product declarations of construction products and services”
ISO 21930:2017, "Sustainability in Building Construction — Environmental Declaration of Building Products" serves as the core PCR along with Sustainable Minds Part A.
SM Part A: LCA calculation rules and report requirements, version 2023
August, 2023. PCR review conducted by the Sustainable Minds TAB, [email protected].
SM Part B: Prefabricated Exterior Wall Panel Assemblies
October, 2025. PCR review conducted by Thomas P. Gloria, Ph.D., Chair (Industrial Ecology Consultants) [email protected]; Hugues Imbeault-Tétreault, ing., M.Sc.A. (Groupe AGÉCO); Lindita Bushi, Ph.D. (Athena Sustainable Materials Institute).
Download PDF SM Transparency Report [EPD]™
SM Transparency Reports (TR) are ISO 14025 Type III environmental declarations (EPD) that enable purchasers and users to compare the potential environmental performance of products on a life cycle basis. They are designed to present information transparently to make the limitations of comparability more understandable. Environmental declarations of products that conform to the same PCR and include the same life cycle stages, but are made by different manufacturers, may not sufficiently align to support direct comparisons. They therefore cannot be used as comparative assertions unless the conditions as defined in ISO 14025 Section 6.7.2. ‘Requirements for Comparability’ are satisfied. In order to support comparative assertions, this EPD meets all comparability requirements stated in ISO 14025:2006. However, differences in certain assumptions, data quality, and variability between LCA data sets may still exist. Any EPD comparison must be carried out at the building level per ISO 21930 guidelines, use the same sub-category PCR where applicable, include all relevant information modules, be limited to EPDs applying a functional unit, and be based on equivalent scenarios with respect to the context of construction works. Some LCA impact categories and inventory items are still under development and can have high levels of uncertainty. To promote uniform guidance on the data collection, calculation, and reporting of results, the ACLCA methodology (ACLCA 2019) was used.
 SM Transparency Report (EPD)