
EPD additional content X-Series: Panelized Exterior Wall Systems
Data
Background This product-specific plant-specific declarations was created by collecting production data from the DBC facility in Phoenix, AZ. All unit processes were modeled using primary data. Secondary data sources include those available in ecoinvent v3.11, Industry data 2.0, and US-EI 2.2 databases. Literature data was used to fill any data gaps to complete the inventory.
Allocation Primary manufacturing data for X-Series EIFS and MCM systems were collected separately for their respective production periods. Allocation of manufacturing resources was performed proportionally to the total square footage produced for each wall system type. Square footage was selected as the allocation metric because it best represents manufacturing effort, capturing material throughput and processing time.
While some recycled materials are used in the upstream production of components and for product packaging, there are no recycled materials used within the DBC facility. The recycled materials come burden free to the product system. There were no co-products manufactured. The allocation procedures used in background data sets were accepted without modification.
Cut-off criteria for including mass and energy flows are set at 1% of renewable primary energy use, 1% of nonrenewable primary energy use, 1% of the total mass input for a unit process, and 1% of environmental impacts. The total of excluded input flows per module shall not exceed 5% for energy, mass, or environmental impacts. An exception is made for substances with hazardous or toxic properties, which must be reported even if they fall below the 1% mass threshold. No known flows are deliberately excluded from this declaration, and no substances considered to be hazardous or toxic according to the TRI or local regulations are present in the products. Therefore, these criteria have been met. Biogenic carbon is included in the reported results.
Quality
Inventory data quality is judged by its precision (measured, calculated, or estimated), completeness (e.g., unreported emissions), consistency (degree of uniformity of the methodology applied on a study serving as a data source), and representativeness (geographical, temporal, and technological).
Sustainable Minds worked with the DBC team to obtain a comprehensive set of primary data associated with the manufacturing processes and supply chain. For purchased components, data was obtained from existing EPDs wherever possible, providing transparent, product-specific environmental information. Where suitable EPDs were not available, assumptions for upstream processing were developed using inputs from DBC, supplemented with secondary resources such as published product documentations, publicly available technical specifications, and relevant industry reports. The product system was checked for mass balance and completeness of the inventory. Capital goods were excluded since they are assumed not to significantly affect the conclusions of the LCA. Otherwise, no data were knowingly omitted. The inventory was considered complete based on our understanding of the manufacturing site, supply chain, and a review with key stakeholders on the DBC team.
Primary data were collected with a similar level of detail, while background data were sourced primarily from the ecoinvent database, and other databases were used if data were not available in ecoinvent or the data set was judged to be more representative. Where country-specific data were unavailable, global or rest-of-world averages were used as proxies. Other methodological choices were made consistently throughout the model.
Upstream EPDs used as data sources
- Box stud insulation: Owens Corning EPD for Thermafiber® Mineral Wool
- U channel: CEMCO EPD for Cold formed steel framing and accessory products
- Gypsum sheathing: Georgia-Pacific Gypsum EPD for 5/8" DensGlass® Fireguard® Sheathing Gypsum Panel
- Diverter track: ClarkDietrich EPD for HDS® Framing System
- Insulfoam: EPS Industry Alliance EPD for EPS Thermal Insulation
- Cement: Salt River Materials Group EPD for Portland Cement
- Z girt: Advanced Architectural Products EPD for GREENGirt
- MCM panel: Alpolic EPD for Metal Composite Panel
Electricity data sets used for manufacturing
- Grid electricity: Electricity mix, eGrid subregion, AZNM/US U
- Solar electricity: Electricity, production mix photovoltaic, at plant/US US-EI U
Scenarios and additional technical information
Major assumptions and limitations:
- Primary data were modeled based on information provided by DBC for specific projects under consideration. However, upstream supply chain data are subject to variability, which may impact the accuracy of the results.
- For upstream components with EPDs, only material compositions were used. LCIA results were not incorporated due to methodological differences. Upstream processes were modeled with secondary data, adjusted for consistency. Results may have differed if primary facility data were available.
- For upstream components without EPDs, material compositions were based on proxies (e.g., similar EPDs, SDSs), with upstream processes modeled from secondary data sets. Results may have differed if actual upstream facility data had been collected.
- For manufacturing facility waste, granular data on waste streams was not available, and all waste was conservatively assumed to be landfilled.
- Generic data sets were used for material inputs, transportation, and waste processing, which are considered to be of good quality. However, actual impacts from material suppliers, transport carriers, and local waste processing may vary, potentially affecting the accuracy of the results.
- No renewable certificates or purchased CO2 offsets were included.
Major system boundary exclusions:
- Construction of major capital equipment
- Manufacturing, maintenance, and operation of support equipment
- Human labor and employee transport
- Manufacture and transport of packaging materials not associated with the final product
- Disposal of packaging materials not associated with the final product
- Manufacturing facility air conditioning
- Product use
Flow diagram
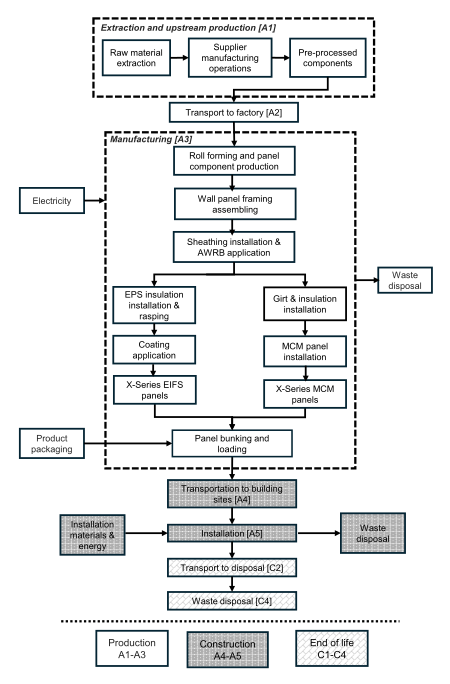
Data sets contributing 10% or more to any environmental impact category
| Data set name | Database name and version | Software type and version |
Geography |
Reference year |
Data set allocation |
| Steel cold rolled coil {GLO} | blast furnace route and electric arc furnace route | production mix, at plant | 1kg, typical thickness between 0.15 - 3 mm. typical width between 600 - 2100 mm | LCI result |
Industry data 2.0 |
SimaPro Craft 10.2 |
Global |
2021 |
System expansion |
| Transport, freight, lorry, 16-32 metric ton, diesel, EURO 6 {RoW}| market for transport, freight, lorry, 16-32 metric ton, diesel, EURO 6 | Cut-off, U |
ecoinvent v3.11 |
SimaPro Craft 10.2 |
Rest of world |
2014 |
Cut-off |
| Glass wool mat {RoW}| glass wool mat production | Cut-off, U |
ecoinvent v3.11 |
SimaPro Craft 10.2 |
Rest of world |
2024 |
Cut-off |
| Fibre, polyester {GLO}| market for fibre, polyester | Cut-off, U |
ecoinvent v3.11 |
SimaPro Craft 10.2 |
Global |
2018 |
Cut-off |
| Gypsum plasterboard {RoW}| gypsum plasterboard production | Cut-off, U (manually updated to match upstream EPD) |
ecoinvent v3.11 |
SimaPro Craft 10.2 |
Rest of world |
2019 |
Cut-off |
| Stone wool {RoW}| stone wool production | Cut-off, U (manually updated to match upstream EPD) |
ecoinvent v3.11 |
SimaPro Craft 10.2 |
Rest of world |
2024 |
Cut-off |
| Steel, low-alloyed {GLO}| market for steel, low-alloyed | Cut-off, U |
ecoinvent v3.11 |
SimaPro Craft 10.2 |
Global |
2020 |
Cut-off |
| Municipal solid waste {RoW}| treatment of municipal solid waste, sanitary landfill | Cut-off, U |
ecoinvent v3.11 |
SimaPro Craft 10.2 |
Rest of world |
2023 |
Cut-off |
| Inert waste {RoW}| treatment of inert waste, sanitary landfill | Cut-off, U |
ecoinvent v3.11 |
SimaPro Craft 10.2 |
Rest of world |
2024 |
Cut-off |
X-Series EIFS: LCIA results, resource use, output and waste flows, and carbon emissions & removals per declared unit
| Parameter | Unit | A1-A3 | A4 | A5 | B1-B7 | C1 | C2 | C3 | C4 |
| Life cycle impact assessment results | |||||||||
| Ozone depletion | kg CFC-11 eq | 9.56E-05 | 3.30E-06 | 3.03E-06 | MND | 0 | 8.64E-07 | 0 | 3.30E-07 |
| Global warming | kg CO2 eq | 2.52E+03 | 2.41E+02 | 2.05E+02 | MND | 0 | 5.39E+01 | 0 | 1.20E+01 |
| Smog | kg O3 eq | 1.08E+02 | 4.79E+00 | 1.28E+01 | MND | 0 | 8.06E+00 | 0 | 2.19E+00 |
| Acidification | kg SO2 eq | 8.34E+00 | 3.34E-01 | 6.93E-01 | MND | 0 | 2.61E-01 | 0 | 1.19E-01 |
| Carcinogenics | CTUh | 3.73E-04 | 6.21E-06 | 5.84E-05 | MND | 0 | 9.40E-08 | 0 | 2.79E-06 |
| Non carcinogenics | CTUh | 6.18E-04 | 3.88E-05 | 4.99E-05 | MND | 0 | 2.56E-06 | 0 | 1.56E-04 |
| Respiratory effects | kg PM2.5 eq | 1.21E+00 | 7.42E-02 | 1.34E-01 | MND | 0 | 3.28E-02 | 0 | 1.41E-02 |
| Ecotoxicity | CTUe | 2.93E+04 | 8.83E+02 | 2.87E+03 | MND | 0 | 1.33E+01 | 0 | 5.31E+03 |
| Freshwater eutrophication | kg P eq | 3.44E-01 | 1.01E-02 | 5.33E-02 | MND | 0 | 1.91E-04 | 0 | 1.32E-02 |
| Marine eutrophication | kg N eq | 9.95E-01 | 4.17E-02 | 9.20E-02 | MND | 0 | 6.75E-02 | 0 | 2.03E-02 |
| Resource use indicators | |||||||||
| Renewable primary energy used as energy carrier (fuel) | MJ, LHV | 8.54E+03 | 6.31E+00 | 1.28E+02 | MND | 0 | 1.29E+00 | 0 | 2.23E+00 |
| Renewable primary resources with energy content used as material | MJ, LHV | 4.24E+00 | 0 | 0 | MND | 0 | 0 | 0 | 0 |
| Total use of renewable primary resources with energy content | MJ, LHV | 8.54E+03 | 6.31E+00 | 1.28E+02 | MND | 0 | 1.29E+00 | 0 | 2.23E+00 |
| Non-renewable primary resources used as an energy carrier (fuel) | MJ, LHV | 3.41E+04 | 3.19E+03 | 2.53E+03 | MND | 0 | 7.04E+02 | 0 | 2.85E+02 |
| Non-renewable primary resources with energy content used as material | MJ, LHV | 2.34E+03 | 0 | 5.88E+02 | MND | 0 | 0 | 0 | 0 |
| Total use of non-renewable primary resources with energy content | MJ, LHV | 3.64E+04 | 3.19E+03 | 3.12E+03 | MND | 0 | 7.04E+02 | 0 | 2.85E+02 |
| Secondary materials | kg | 4.23E+00 | 0 | 0 | MND | 0 | 0 | 0 | 0 |
| Renewable secondary fuels | MJ, LHV | 0 | 0 | 0 | MND | 0 | 0 | 0 | 0 |
| Non-renewable secondary fuels | MJ, LHV | 0 | 0 | 0 | MND | 0 | 0 | 0 | 0 |
| Recovered energy | MJ, LHV | 0 | 0 | 0 | MND | 0 | 0 | 0 | 0 |
| Use of net fresh water resources | m3 | 3.55E+03 | 2.93E+01 | 4.71E+02 | MND | 0 | 5.33E+00 | 0 | 1.50E+01 |
| Abiotic depletion potential for fossil resources | MJ, LHV | 3.42E+04 | 3.18E+03 | 3.00E+03 | MND | 0 | 7.02E+02 | 0 | 2.83E+02 |
| Output flows and waste category indicators | |||||||||
| Hazardous waste disposed | kg | 1.29E+00 | 3.31E-02 | 1.45E-01 | MND | 0 | 5.20E-03 | 0 | 5.97E-02 |
| Non-hazardous waste disposed | kg | 1.71E+02 | 2.64E-01 | 1.28E+01 | MND | 0 | 2.03E-02 | 0 | 1.26E+03 |
| High-level radioactive waste, conditioned, to final repository | kg | 6.20E-03 | 4.38E-05 | 4.92E-04 | MND | 0 | 9.08E-06 | 0 | 1.10E-05 |
| Intermediate- and low-level radioactive waste, conditioned, to final repository | kg | 1.48E-02 | 9.20E-05 | 1.24E-03 | MND | 0 | 1.95E-05 | 0 | 2.62E-05 |
| Components for re-use | kg | 0 | 0 | 2.23E+02 | MND | 0 | 0 | 0 | 0 |
| Materials for recycling | kg | 1.58E+01 | 0 | 0 | MND | 0 | 0 | 0 | 0 |
| Materials for energy recovery | kg | 2.19E-07 | 0 | 2.50E+00 | MND | 0 | 0 | 0 | 0 |
| Exported energy | MJ, LHV | 0 | 0 | 0 | MND | 0 | 0 | 0 | 0 |
| Carbon emissions and removals | |||||||||
| Biogenic Carbon Removal from Product | kg CO2 | 0 | 0 | 0 | MND | 0 | 0 | 0 | 0 |
| Biogenic Carbon Emission from Product | kg CO2 | 0 | 0 | 0 | MND | 0 | 0 | 0 | 0 |
| Biogenic Carbon Removal from Packaging | kg CO2 | -3.49E+02 | 0 | 0 | MND | 0 | 0 | 0 | 0 |
| Biogenic Carbon Emission from Packaging | kg CO2 | 1.74E-01 | 0 | 3.49E+02 | MND | 0 | 0 | 0 | 0 |
| Biogenic Carbon Emission from Combustion of Waste from Renewable Sources Used in Production Processes | kg CO2 | 0 | 0 | 0 | MND | 0 | 0 | 0 | 0 |
| Calcination Carbon Emissions | kg CO2 | 6.39E-01 | 0 | 0 | MND | 0 | 0 | 0 | 0 |
| Carbonation Carbon Removals | kg CO2 | 0 | 0 | 0 | MND | 0 | 0 | 0 | 0 |
| Carbon Emissions from Combustion of Waste from Non-Renewable Sources used in Production Processes | kg CO2 | 0 | 0 | 0 | MND | 0 | 0 | 0 | 0 |
X-Series EIFS (with openings): LCIA results, resource use, output and waste flows, and carbon emissions & removals per declared unit
| Parameter | Unit | A1-A3 | A4 | A5 | B1-B7 | C1 | C2 | C3 | C4 |
| Life cycle impact assessment results | |||||||||
| Ozone depletion | kg CFC-11 eq | 8.77E-05 | 3.23E-06 | 3.39E-06 | MND | 0 | 8.42E-07 | 0 | 3.21E-07 |
| Global warming | kg CO2 eq | 2.59E+03 | 2.35E+02 | 2.30E+02 | MND | 0 | 5.25E+01 | 0 | 1.16E+01 |
| Smog | kg O3 eq | 1.11E+02 | 4.69E+00 | 1.38E+01 | MND | 0 | 7.85E+00 | 0 | 2.14E+00 |
| Acidification | kg SO2 eq | 8.47E+00 | 3.27E-01 | 7.62E-01 | MND | 0 | 2.54E-01 | 0 | 1.15E-01 |
| Carcinogenics | CTUh | 9.07E-04 | 6.07E-06 | 6.62E-05 | MND | 0 | 9.15E-08 | 0 | 2.94E-06 |
| Non carcinogenics | CTUh | 8.37E-04 | 3.79E-05 | 5.65E-05 | MND | 0 | 2.49E-06 | 0 | 1.49E-04 |
| Respiratory effects | kg PM2.5 eq | 1.33E+00 | 7.26E-02 | 1.49E-01 | MND | 0 | 3.19E-02 | 0 | 1.36E-02 |
| Ecotoxicity | CTUe | 4.35E+04 | 8.64E+02 | 3.25E+03 | MND | 0 | 1.30E+01 | 0 | 5.08E+03 |
| Freshwater eutrophication | kg P eq | 3.81E-01 | 9.85E-03 | 6.04E-02 | MND | 0 | 1.86E-04 | 0 | 1.24E-02 |
| Marine eutrophication | kg N eq | 1.03E+00 | 4.08E-02 | 9.79E-02 | MND | 0 | 6.58E-02 | 0 | 1.96E-02 |
| Resource use indicators | |||||||||
| Renewable primary energy used as energy carrier (fuel) | MJ, LHV | 8.79E+03 | 6.18E+00 | 1.45E+02 | MND | 0 | 1.26E+00 | 0 | 2.17E+00 |
| Renewable primary resources with energy content used as material | MJ, LHV | 3.74E+00 | 0 | 0 | MND | 0 | 0 | 0 | 0 |
| Total use of renewable primary resources with energy content | MJ, LHV | 8.79E+03 | 6.18E+00 | 1.45E+02 | MND | 0 | 1.26E+00 | 0 | 2.17E+00 |
| Non-renewable primary resources used as an energy carrier (fuel) | MJ, LHV | 3.47E+04 | 3.12E+03 | 2.83E+03 | MND | 0 | 6.86E+02 | 0 | 2.78E+02 |
| Non-renewable primary resources with energy content used as material | MJ, LHV | 2.07E+03 | 0 | 6.66E+02 | MND | 0 | 0 | 0 | 0 |
| Total use of non-renewable primary resources with energy content | MJ, LHV | 3.68E+04 | 3.12E+03 | 3.49E+03 | MND | 0 | 6.86E+02 | 0 | 2.78E+02 |
| Secondary materials | kg | 3.43E+01 | 0 | 0 | MND | 0 | 0 | 0 | 0 |
| Renewable secondary fuels | MJ, LHV | 0 | 0 | 0 | MND | 0 | 0 | 0 | 0 |
| Non-renewable secondary fuels | MJ, LHV | 0 | 0 | 0 | MND | 0 | 0 | 0 | 0 |
| Recovered energy | MJ, LHV | 0 | 0 | 0 | MND | 0 | 0 | 0 | 0 |
| Use of net fresh water resources | m3 | 2.94E+03 | 2.00E+01 | 3.92E+02 | MND | 0 | 4.17E+00 | 0 | 7.63E+00 |
| Abiotic depletion potential for fossil resources | MJ, LHV | 3.44E+04 | 3.11E+03 | 3.36E+03 | MND | 0 | 6.84E+02 | 0 | 2.75E+02 |
| Output flows and waste category indicators | |||||||||
| Hazardous waste disposed | kg | 1.62E+00 | 3.24E-02 | 1.64E-01 | MND | 0 | 5.07E-03 | 0 | 5.76E-02 |
| Non-hazardous waste disposed | kg | 1.89E+02 | 2.58E-01 | 1.45E+01 | MND | 0 | 1.97E-02 | 0 | 1.23E+03 |
| High-level radioactive waste, conditioned, to final repository | kg | 6.77E-03 | 4.28E-05 | 5.58E-04 | MND | 0 | 8.84E-06 | 0 | 1.07E-05 |
| Intermediate- and low-level radioactive waste, conditioned, to final repository | kg | 1.60E-02 | 9.00E-05 | 1.40E-03 | MND | 0 | 1.90E-05 | 0 | 2.56E-05 |
| Components for re-use | kg | 0.00E+00 | 0 | 2.23E+02 | MND | 0 | 0 | 0 | 0 |
| Materials for recycling | kg | 1.40E+01 | 0 | 0 | MND | 0 | 0 | 0 | 0 |
| Materials for energy recovery | kg | 1.93E-07 | 0 | 2.50E+00 | MND | 0 | 0 | 0 | 0 |
| Exported energy | MJ, LHV | 0 | 0 | 0 | MND | 0 | 0 | 0 | 0 |
| Carbon emissions and removals | |||||||||
| Biogenic Carbon Removal from Product | kg CO2 | 0 | 0 | 0 | MND | 0 | 0 | 0 | 0 |
| Biogenic Carbon Emission from Product | kg CO2 | 0 | 0 | 0 | MND | 0 | 0 | 0 | 0 |
| Biogenic Carbon Removal from Packaging | kg CO2 | -3.49E+02 | 0 | 0 | MND | 0 | 0 | 0 | 0 |
| Biogenic Carbon Emission from Packaging | kg CO2 | 1.54E-01 | 0 | 3.49E+02 | MND | 0 | 0 | 0 | 0 |
| Biogenic Carbon Emission from Combustion of Waste from Renewable Sources Used in Production Processes | kg CO2 | 0 | 0 | 0 | MND | 0 | 0 | 0 | 0 |
| Calcination Carbon Emissions | kg CO2 | 5.63E-01 | 0 | 0 | MND | 0 | 0 | 0 | 0 |
| Carbonation Carbon Removals | kg CO2 | 0 | 0 | 0 | MND | 0 | 0 | 0 | 0 |
| Carbon Emissions from Combustion of Waste from Non-Renewable Sources used in Production Processes | kg CO2 | 0 | 0 | 0 | MND | 0 | 0 | 0 | 0 |
X-Series MCM: LCIA results, resource use, output and waste flows, and carbon emissions & removals per declared unit
| Parameter | Unit | A1-A3 | A4 | A5 | B1-B7 | C1 | C2 | C3 | C4 |
| Life cycle impact assessment results | |||||||||
| Ozone depletion | kg CFC-11 eq | 4.97E-05 | 6.56E-06 | 3.48E-06 | MND | 0 | 1.26E-06 | 0 | 4.81E-07 |
| Global warming | kg CO2 eq | 3.46E+03 | 4.78E+02 | 2.37E+02 | MND | 0 | 7.85E+01 | 0 | 1.72E+01 |
| Smog | kg O3 eq | 1.43E+02 | 9.51E+00 | 1.71E+01 | MND | 0 | 1.17E+01 | 0 | 3.20E+00 |
| Acidification | kg SO2 eq | 1.21E+01 | 6.63E-01 | 8.38E-01 | MND | 0 | 3.80E-01 | 0 | 1.73E-01 |
| Carcinogenics | CTUh | 1.32E-03 | 1.23E-05 | 5.89E-05 | MND | 0 | 1.37E-07 | 0 | 4.29E-06 |
| Non carcinogenics | CTUh | 1.15E-03 | 7.70E-05 | 5.37E-05 | MND | 0 | 3.73E-06 | 0 | 2.22E-04 |
| Respiratory effects | kg PM2.5 eq | 1.82E+00 | 1.47E-01 | 1.56E-01 | MND | 0 | 4.78E-02 | 0 | 2.04E-02 |
| Ecotoxicity | CTUe | 6.46E+04 | 1.75E+03 | 3.06E+03 | MND | 0 | 1.94E+01 | 0 | 7.54E+03 |
| Freshwater eutrophication | kg P eq | 5.28E-01 | 2.00E-02 | 5.81E-02 | MND | 0 | 2.78E-04 | 0 | 1.37E-02 |
| Marine eutrophication | kg N eq | 1.50E+00 | 8.27E-02 | 1.28E-01 | MND | 0 | 9.83E-02 | 0 | 2.70E-02 |
| Resource use indicators | |||||||||
| Renewable primary energy used as energy carrier (fuel) | MJ, LHV | 8.27E+03 | 1.25E+01 | 1.29E+02 | MND | 0 | 1.88E+00 | 0 | 3.25E+00 |
| Renewable primary resources with energy content used as material | MJ, LHV | 1.76E+02 | 0 | 0 | MND | 0 | 0 | 0 | 0 |
| Total use of renewable primary resources with energy content | MJ, LHV | 8.45E+03 | 1.25E+01 | 1.29E+02 | MND | 0 | 1.88E+00 | 0 | 3.25E+00 |
| Non-renewable primary resources used as an energy carrier (fuel) | MJ, LHV | 4.17E+04 | 6.33E+03 | 2.93E+03 | MND | 0 | 1.03E+03 | 0 | 4.15E+02 |
| Non-renewable primary resources with energy content used as material | MJ, LHV | 3.36E+03 | 0 | 5.88E+02 | MND | 0 | 0 | 0 | 0 |
| Total use of non-renewable primary resources with energy content | MJ, LHV | 4.50E+04 | 6.33E+03 | 3.52E+03 | MND | 0 | 1.03E+03 | 0 | 4.15E+02 |
| Secondary materials | kg | 7.39E+02 | 0 | 0 | MND | 0 | 0 | 0 | 0 |
| Renewable secondary fuels | MJ, LHV | 0 | 0 | 0 | MND | 0 | 0 | 0 | 0 |
| Non-renewable secondary fuels | MJ, LHV | 0 | 0 | 0 | MND | 0 | 0 | 0 | 0 |
| Recovered energy | MJ, LHV | 0 | 0 | 0 | MND | 0 | 0 | 0 | 0 |
| Use of net fresh water resources | m3 | 3.68E+03 | 4.05E+01 | 3.49E+02 | MND | 0 | 6.23E+00 | 0 | 1.14E+01 |
| Abiotic depletion potential for fossil resources | MJ, LHV | 4.20E+04 | 6.32E+03 | 3.40E+03 | MND | 0 | 1.02E+03 | 0 | 4.12E+02 |
| Output flows and waste category indicators | |||||||||
| Hazardous waste disposed | kg | 1.54E+00 | 6.57E-02 | 1.55E-01 | MND | 0 | 7.58E-03 | 0 | 8.65E-02 |
| Non-hazardous waste disposed | kg | 3.05E+02 | 5.24E-01 | 1.42E+01 | MND | 0 | 2.95E-02 | 0 | 1.84E+03 |
| High-level radioactive waste, conditioned, to final repository | kg | 8.09E-03 | 8.69E-05 | 4.98E-04 | MND | 0 | 1.32E-05 | 0 | 1.60E-05 |
| Intermediate- and low-level radioactive waste, conditioned, to final repository | kg | 1.98E-02 | 1.83E-04 | 1.25E-03 | MND | 0 | 2.84E-05 | 0 | 3.82E-05 |
| Components for re-use | kg | 6.48E+01 | 0 | 2.23E+02 | MND | 0 | 0 | 0 | 0 |
| Materials for recycling | kg | 2.44E+02 | 0 | 0 | MND | 0 | 0 | 0 | 0 |
| Materials for energy recovery | kg | 0 | 0 | 2.50E+00 | MND | 0 | 0 | 0 | 0 |
| Exported energy | MJ, LHV | 0 | 0 | 0 | MND | 0 | 0 | 0 | 0 |
| Carbon emissions and removals | |||||||||
| Biogenic Carbon Removal from Product | kg CO2 | 0 | 0 | 0 | MND | 0 | 0 | 0 | 0 |
| Biogenic Carbon Emission from Product | kg CO2 | 0 | 0 | 0 | MND | 0 | 0 | 0 | 0 |
| Biogenic Carbon Removal from Packaging | kg CO2 | -3.57E+02 | 0 | 0 | MND | 0 | 0 | 0 | 0 |
| Biogenic Carbon Emission from Packaging | kg CO2 | 8.49E+00 | 0 | 3.49E+02 | MND | 0 | 0 | 0 | 0 |
| Biogenic Carbon Emission from Combustion of Waste from Renewable Sources Used in Production Processes | kg CO2 | 0 | 0 | 0 | MND | 0 | 0 | 0 | 0 |
| Calcination Carbon Emissions | kg CO2 | 1.13E+01 | 0 | 0 | MND | 0 | 0 | 0 | 0 |
| Carbonation Carbon Removals | kg CO2 | 0 | 0 | 0 | MND | 0 | 0 | 0 | 0 |
| Carbon Emissions from Combustion of Waste from Non-Renewable Sources used in Production Processes | kg CO2 | 0 | 0 | 0 | MND | 0 | 0 | 0 | 0 |
X-Series MCM (with openings): LCIA results, resource use, output and waste flows, and carbon emissions & removals per declared unit
| Parameter | Unit | A1-A3 | A4 | A5 | B1-B7 | C1 | C2 | C3 | C4 |
| Life cycle impact assessment results | |||||||||
| Ozone depletion | kg CFC-11 eq | 4.61E-05 | 6.12E-06 | 3.89E-06 | MND | 0 | 1.16E-06 | 0 | 4.45E-07 |
| Global warming | kg CO2 eq | 3.44E+03 | 4.46E+02 | 2.63E+02 | MND | 0 | 7.26E+01 | 0 | 1.61E+01 |
| Smog | kg O3 eq | 1.41E+02 | 8.88E+00 | 1.83E+01 | MND | 0 | 1.09E+01 | 0 | 2.96E+00 |
| Acidification | kg SO2 eq | 1.17E+01 | 6.19E-01 | 9.22E-01 | MND | 0 | 3.51E-01 | 0 | 1.59E-01 |
| Carcinogenics | CTUh | 1.52E-03 | 1.15E-05 | 6.91E-05 | MND | 0 | 1.27E-07 | 0 | 4.22E-06 |
| Non carcinogenics | CTUh | 1.35E-03 | 7.18E-05 | 6.04E-05 | MND | 0 | 3.45E-06 | 0 | 2.04E-04 |
| Respiratory effects | kg PM2.5 eq | 1.84E+00 | 1.37E-01 | 1.74E-01 | MND | 0 | 4.42E-02 | 0 | 1.88E-02 |
| Ecotoxicity | CTUe | 7.60E+04 | 1.64E+03 | 3.37E+03 | MND | 0 | 1.80E+01 | 0 | 6.92E+03 |
| Freshwater eutrophication | kg P eq | 5.78E-01 | 1.86E-02 | 6.19E-02 | MND | 0 | 2.57E-04 | 0 | 1.63E-02 |
| Marine eutrophication | kg N eq | 1.45E+00 | 7.72E-02 | 1.35E-01 | MND | 0 | 9.10E-02 | 0 | 2.54E-02 |
| Resource use indicators | |||||||||
| Renewable primary energy used as energy carrier (fuel) | MJ, LHV | 8.33E+03 | 1.17E+01 | 1.51E+02 | MND | 0 | 1.74E+00 | 0 | 3.00E+00 |
| Renewable primary resources with energy content used as material | MJ, LHV | 1.49E+02 | 0 | 0 | MND | 0 | 0 | 0 | 0 |
| Total use of renewable primary resources with energy content | MJ, LHV | 8.48E+03 | 1.17E+01 | 1.51E+02 | MND | 0 | 1.74E+00 | 0 | 3.00E+00 |
| Non-renewable primary resources used as an energy carrier (fuel) | MJ, LHV | 4.16E+04 | 5.91E+03 | 3.26E+03 | MND | 0 | 9.49E+02 | 0 | 3.84E+02 |
| Non-renewable primary resources with energy content used as material | MJ, LHV | 2.85E+03 | 0 | 6.92E+02 | MND | 0 | 0 | 0 | 0 |
| Total use of non-renewable primary resources with energy content | MJ, LHV | 4.44E+04 | 5.91E+03 | 3.95E+03 | MND | 0 | 9.49E+02 | 0 | 3.84E+02 |
| Secondary materials | kg | 6.67E+02 | 0.00E+00 | 0.00E+00 | MND | 0 | 0.00E+00 | 0 | 0.00E+00 |
| Renewable secondary fuels | MJ, LHV | 0 | 0 | 0 | MND | 0 | 0 | 0 | 0 |
| Non-renewable secondary fuels | MJ, LHV | 0 | 0 | 0 | MND | 0 | 0 | 0 | 0 |
| Recovered energy | MJ, LHV | 0 | 0 | 0 | MND | 0 | 0 | 0 | 0 |
| Use of net fresh water resources | m3 | 3.69E+03 | 3.78E+01 | 4.10E+02 | MND | 0 | 5.77E+00 | 0 | 1.06E+01 |
| Abiotic depletion potential for fossil resources | MJ, LHV | 4.13E+04 | 5.89E+03 | 3.82E+03 | MND | 0 | 9.46E+02 | 0 | 3.81E+02 |
| Output flows and waste category indicators | |||||||||
| Hazardous waste disposed | kg | 1.76E+00 | 6.13E-02 | 1.71E-01 | MND | 0 | 7.01E-03 | 0 | 7.93E-02 |
| Non-hazardous waste disposed | kg | 3.47E+02 | 4.89E-01 | 1.46E+01 | MND | 0 | 2.73E-02 | 0 | 1.70E+03 |
| High-level radioactive waste, conditioned, to final repository | kg | 8.53E-03 | 8.10E-05 | 5.84E-04 | MND | 0 | 1.22E-05 | 0 | 1.48E-05 |
| Intermediate- and low-level radioactive waste, conditioned, to final repository | kg | 2.05E-02 | 1.70E-04 | 1.47E-03 | MND | 0 | 2.63E-05 | 0 | 3.54E-05 |
| Components for re-use | kg | 5.50E+01 | 0 | 2.23E+02 | MND | 0 | 0 | 0 | 0 |
| Materials for recycling | kg | 2.07E+02 | 0 | 0 | MND | 0 | 0 | 0 | 0 |
| Materials for energy recovery | kg | 0 | 0 | 2.50E+00 | MND | 0 | 0 | 0 | 0 |
| Exported energy | MJ, LHV | 0 | 0 | 0 | MND | 0 | 0 | 0 | 0 |
| Carbon emissions and removals | |||||||||
| Biogenic Carbon Removal from Product | kg CO2 | 0 | 0 | 0 | MND | 0 | 0 | 0 | 0 |
| Biogenic Carbon Emission from Product | kg CO2 | 0 | 0 | 0 | MND | 0 | 0 | 0 | 0 |
| Biogenic Carbon Removal from Packaging | kg CO2 | -3.56E+02 | 0 | 0 | MND | 0 | 0 | 0 | 0 |
| Biogenic Carbon Emission from Packaging | kg CO2 | 7.22E+00 | 0 | 3.49E+02 | MND | 0 | 0 | 0 | 0 |
| Biogenic Carbon Emission from Combustion of Waste from Renewable Sources Used in Production Processes | kg CO2 | 0.00E+00 | 0 | 0 | MND | 0 | 0 | 0 | 0 |
| Calcination Carbon Emissions | kg CO2 | 9.58E+00 | 0 | 0 | MND | 0 | 0 | 0 | 0 |
| Carbonation Carbon Removals | kg CO2 | 0 | 0 | 0 | MND | 0 | 0 | 0 | 0 |
| Carbon Emissions from Combustion of Waste from Non-Renewable Sources used in Production Processes | kg CO2 | 0 | 0 | 0 | MND | 0 | 0 | 0 | 0 |
 SM Transparency Report (EPD)