EPD additional content StoneLite®
Data
Background This product-specific plant-specific declaration was created by collecting production and supply chain data for Coldspring's manufacturing facility in Marble Falls, TX. Upstream data for stone quarrying operations was adopted from Natural Stone Institute’s (NSI) industry-wide stone cladding LCA published in November 2022. All unit processes were modeled using primary data. Secondary data sources include those available in the ecoinvent v3.10, US-EI 2.2, and Industry data 2.0 databases.
Allocation Since manufacturing resources other than electricity were used across all types of StoneLite® panels, and not dedicated solely to specific panel types, they were evenly distributed based on production area. The annual manufacturing resource use was calculated relative to the annual production area and further weighted according to each year’s production levels, providing a comprehensive, area-based annual resource allocation. Electricity measurement varied due to specific equipment requirements, and porcelain processing was estimated to need approximately 15% less electricity than stone-based processing. The total amount of electricity consumed each year was therefore calculated separately for natural stone panels and porcelain panels. No recycled materials are used in the product system, and there were no co-products manufactured.
Cut-off criteria for the inclusion of mass and energy flows are 1% of renewable primary resource (energy) usage, 1% nonrenewable primary resource (energy) usage, 1% of the total mass input of that unit process, and 1% of environmental impacts. The total of neglected input flows per module does not exceed 5% of energy usage, mass, and environmental impacts. The only exceptions to these criteria are substances with hazardous and toxic properties, which must be listed even when the given process unit is under the cut-off criterion of 1% of the total mass.
In the absence of suitable proxy data sets, some ingredients making up the epoxies and bonding putties were excluded; however, the cumulative mass of excluded ingredients is less than 1% of the product system. No known energy flow has been omitted in this study, and the excluded ingredients are expected to have an insignificant effect on environmental impacts.
All known hazardous wastes released from the manufacturing facility have been included in this study, including methyl ethyl ketone which is used for cleaning purposes and is not a part of the final product. No carbonation or calcination is expected to occur during the production and manufacture of the panels. Biogenic carbon is included in reported results.
Quality Temporal and technological representativeness are considered to be high. Geographical representativeness is considered to be high. All relevant process steps for the product system were considered and modeled. The process chain is considered sufficiently complete with regards to the goal and scope of this study.
The product system was checked for mass balance and completeness of the inventory. Capital goods were excluded since they are assumed not to significantly affect the conclusions of the LCA. Otherwise, no data were knowingly omitted. For more information on data quality, see the LCA background report.
Flow diagram
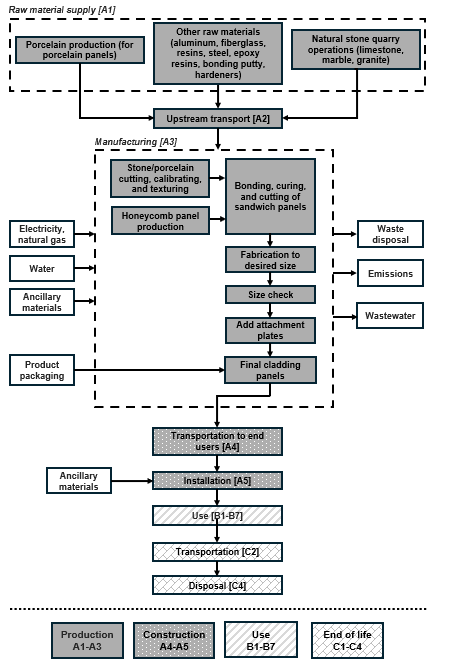
Major system boundary exclusions
- Construction of major capital equipment
- Maintenance of operation and support equipment
- Human labor and employee transport
- Manufacture and transport of packaging not associated with final product
- Building operational energy and water use not associated with final product
Major assumptions and limitations
- It was estimated that porcelain panels consume 15% less electricity than natural stone panels; however, slight deviations are possible
- Generic data sets used for material inputs, transport, and waste processing are considered good quality, but actual impacts from material suppliers, transport carriers, and local waste processing may vary
- The impact assessment methodology categories do not represent all possible environmental impact categories
- Characterization factors used within the impact assessment methodology may contain varying levels of uncertainty
- LCA results are relative expressions and do not predict impacts on category endpoints, the exceeding of thresholds, safety margins or risks
Scenarios and additional technical information
| PARAMETER | Lim | Gra | Mar | Por | UNIT |
| Transport to the building site [A4] | |||||
| Fuel type |
Diesel |
||||
| Vehicle type |
Lorry (16-32 metric ton) |
||||
| Liters of fuel |
0.10 |
0.11 |
0.11 |
0.10 |
l/100 km |
| Avg distance from facility to installation site |
500 |
km |
|||
| Capacity utilization (mass based) |
100 |
% |
|||
| Gross density |
766 |
882 |
858 |
782 |
kg/m³ |
| Capacity utilization volume factor |
1 |
||||
| Installation into the building [A5] | |||||
| Installation scrap rate | 1 | % | |||
| Ancillary materials: Masonry connectors | 0.62 | kg | |||
| Product loss per functional unit | 0.19 | 0.22 | 0.21 | 0.19 | kg |
| Waste materials at the construction site before waste processing (installation scraps, and packaging waste) | 4.78 | 4.81 | 4.8 | 4.78 | kg |
| Output materials from on-site waste processing | 0 | kg | |||
| Mass of wood (lumber) packaging waste | 4.44 | kg | |||
| Mass of plastic foam packaging waste | 0.15 | kg | |||
| Biogenic carbon contained in packaging | 8.15 | kg CO2 | |||
| Direct emissions to ambient air, soil, and water | 0 | kg | |||
| VOC emissions | 0 | μg/m3 | |||
| Note: All other A5 parameters (net freshwater consumption, other resources, electricity consumption, other energy carriers) are not applicable. | |||||
| Use parameters [B1-B7] | |||||
| Reference service life (RSL) | 75 | years | |||
| Estimated service life (ESL) | 75 | years | |||
| Declared product properties | Refer to 'Product technical information' table below | ||||
| Design application parameters | ASTM E-84 Flame Spread: 5 maximum ASTM D-2015 Potential heat of combustion: 1150 BTU/lb maximum Modified ASTM E-108 Fire evaluation: Resist 30 minutes fire exposure ASTM E 283 Air infiltration: 0.06 cfm/ft2 maximum | ||||
| Assumed quality of work | Panel is expected to last the life of the building when installed per manufacturer's instructions | ||||
| Outdoor environment | All conditions, including extreme heat, freezing thaw, earthquakes, tornadoes, and hurricanes | ||||
| Indoor environment | Ideal for overhead applications, interior landscaping, feature walls etc. | ||||
| Use conditions | All conditions (indoor and outdoor) | ||||
| Maintenance process information | N/A | ||||
| Note: Modules B1-B7 were considered but deemed not to apply. | |||||
| End of life [C1-C4] | |||||
| Assumptions for scenario development | Following manual removal of panels, they are transported 100 km to the disposal site | ||||
| Collected with mixed construction waste | 18.8 | 21.8 | 21.2 | 19.2 | kg |
| Waste transport | 100 | km | |||
| Recycling | 14 | 16.2 | 15.8 | 14.3 | kg |
| Landfill | 4.73 | 5.48 | 5.33 | 4.83 | kg |
| Incinerated w/o energy recovery | 0.09 | 0.09 | 0.09 | 0.09 | kg |
| Removals of biogenic carbon (excluding packaging) | 0 | kg CO2 | |||
| Product technical information | |||
| Parameters | Values | Unit | Test method |
| Panel thickness | 25.4 | mm | N/A |
| Standard panel dimensions | 1.22 L * 2.44 m W, normalized to 1 m2 | N/A | |
| Width | 2.44 | m | N/A |
| Flexural strength | 5.12 – 5.66 | Mpa | ASTM C880 |
| Thermal conductivity (k-value) | 2.22 – 3.22 | W/mK | ASTM C518 |
| Thermal resistance (R-value) | 0.32 – 0.47 | mK/W | ASTM C518 |
| Liquid water absorption | 0.4% – 2.1% | % of dry weight | ASTM C97 |
| Available product finishes | Available finishes are honed, polished, sanded, thermal, brushed, bush hammered, and water jet. Not all finishes are applicable for all types of stone. | ||
LCIA impact factors required by the PCR are global warming, ozone depletion, acidification, eutrophication, smog, and fossil fuel depletion; “These six impact categories are globally deemed mature enough to be included in Type III environmental declarations. Other categories are being developed and defined and LCA should continue making advances in their development. However, the EPD users shall not use additional measures for comparative purposes.”
LCIA results, resource use, output and waste flows, and carbon emissions & removals per functional unit
Modules B1-B7, C1, and C2 each have a reported value of zero. Module D is not declared.
StoneLite® limestone panels: results per functional unit
| Parameter | Unit | A1 |
A2 |
A3 |
A4 |
A5 |
C2 |
C4 |
Total |
| LCIA results |
|||||||||
| Ozone depletion |
kg CFC-11 eq |
8.06E-07 |
4.63E-06 |
1.67E-06 |
3.23E-07 |
1.32E-07 |
4.76E-07 |
3.55E-09 |
8.05E-06 |
| Global warming |
kg CO2 eq |
3.28E+01 |
2.39E+01 |
5.95E+01 |
1.62E+00 |
2.54E+00 |
2.37E+00 |
7.75E-01 |
1.23E+02 |
| Smog |
kg O3 eq |
1.95E+00 |
1.91E+00 |
1.79E+00 |
1.33E-01 |
1.67E-01 |
3.85E-01 |
6.91E-03 |
6.34E+00 |
| Acidification |
kg SO2 eq |
1.39E-01 |
7.30E-02 |
1.65E-01 |
5.07E-03 |
7.48E-03 |
1.31E-02 |
3.49E-04 |
4.03E-01 |
| Eutrophication |
kg N eq |
2.03E-02 |
9.75E-03 |
2.82E-02 |
6.82E-04 |
7.12E-04 |
1.34E-03 |
1.98E-03 |
6.30E-02 |
| Carcinogenics |
CTUh |
3.65E-07 |
1.00E-08 |
1.63E-07 |
6.72E-10 |
6.96E-09 |
6.78E-10 |
4.83E-09 |
5.51E-07 |
| Non-carcinogenics |
CTUh |
2.06E-06 |
9.42E-07 |
1.35E-06 |
6.08E-08 |
1.04E-07 |
1.13E-07 |
6.48E-09 |
4.64E-06 |
| Respiratory effects |
kg PM2.5 eq |
2.31E-02 |
4.73E-03 |
1.12E-02 |
3.18E-04 |
6.45E-04 |
1.53E-03 |
3.04E-05 |
4.15E-02 |
| Additional environmental information |
|||||||||
| Ecotoxicity |
CTUe |
3.94E+01 |
1.41E+01 |
7.16E+00 |
8.82E-01 |
4.44E-01 |
3.05E-01 |
2.40E-01 |
6.25E+01 |
| Fossil fuel depletion |
MJ surplus |
4.05E+01 |
4.57E+01 |
9.03E+01 |
3.10E+00 |
2.16E+00 |
4.57E+00 |
5.06E-02 |
1.86E+02 |
| Resource use indicators |
|||||||||
| Renewable primary energy used as energy carrier (fuel) |
MJ, LHV |
2.34E+01 |
5.24E-01 |
1.59E+02 |
3.53E-02 |
6.26E-01 |
5.14E-02 |
1.72E-02 |
1.84E+02 |
| Renewable primary resources with energy content used as material |
MJ, LHV |
3.46E-01 |
0 |
0 |
0 |
3.46E-03 |
0 |
0 |
3.49E-01 |
| Total use of renewable primary resources with energy content |
MJ, LHV |
2.37E+01 |
5.24E-01 |
1.59E+02 |
3.53E-02 |
6.29E-01 |
5.14E-02 |
1.72E-02 |
1.84E+02 |
| Non-renewable primary resources used as an energy carrier (fuel) |
MJ, LHV |
4.56E+02 |
3.20E+02 |
8.59E+02 |
2.17E+01 |
2.76E+01 |
3.20E+01 |
4.54E-01 |
1.72E+03 |
| Non-renewable primary resources with energy content used as material |
MJ, LHV |
9.85E-02 |
0 |
0 |
0 |
9.85E-04 |
0 |
0 |
9.95E-02 |
| Total use of non-renewable primary resources with energy content |
MJ, LHV |
4.56E+02 |
3.20E+02 |
8.59E+02 |
2.17E+01 |
2.76E+01 |
3.20E+01 |
4.54E-01 |
1.72E+03 |
| Secondary materials |
kg |
0 |
0 |
0 |
0 |
0 |
0 |
0 |
0 |
| Renewable secondary fuels |
MJ, LHV |
0 |
0 |
0 |
0 |
0 |
0 |
0 |
0 |
| Non-renewable secondary fuels |
MJ, LHV |
0 |
0 |
0 |
0 |
0 |
0 |
0 |
0 |
| Recovered energy |
MJ, LHV |
0 |
0 |
0 |
0 |
0 |
0 |
0 |
0 |
| Use of net fresh water resources |
m3 |
1.11E+02 |
1.53E+00 |
1.74E+01 |
1.01E-01 |
1.62E-01 |
1.47E-01 |
4.87E-02 |
1.30E+02 |
| Abiotic depletion potential for fossil resources |
MJ, LHV |
4.15E+02 |
3.20E+01 |
2.40E+01 |
6.12E+01 |
1.60E+00 |
2.60E+00 |
2.37E+00 |
5.39E+02 |
| Output flows and waste category indicators |
|||||||||
| Hazardous waste disposed |
kg |
2.65E-04 |
0 |
0 |
0 |
0 |
0 |
0 |
2.65E-04 |
| Non-hazardous waste disposed |
kg |
1.12E-02 |
0 |
1.09E+01 |
0 |
3.13E+00 |
0 |
4.73E+00 |
1.87E+01 |
| High-level radioactive waste, conditioned, to final repository |
kg |
1.02E-04 |
5.58E-06 |
3.47E-04 |
3.82E-07 |
2.39E-07 |
5.55E-07 |
1.85E-07 |
4.55E-04 |
| Intermediate- and low-level radioactive waste, conditioned, to final repository |
kg |
2.44E-04 |
1.24E-05 |
7.74E-04 |
8.51E-07 |
5.32E-07 |
1.24E-06 |
4.13E-07 |
1.03E-03 |
| Components for re-use |
kg |
0 |
0 |
0 |
0 |
0 |
0 |
0 |
0 |
| Materials for recycling |
kg |
4.88E+01 |
0 |
1.01E+01 |
0 |
9.23E-01 |
0 |
1.40E+01 |
7.38E+01 |
| Materials for energy recovery |
kg |
0 |
0 |
4.39E-01 |
0 |
7.23E-01 |
0 |
9.29E-02 |
1.25E+00 |
| Exported energy |
MJ, LHV |
0 |
0 |
0 |
0 |
0 |
0 |
0 |
0 |
| Carbon emissions and removals |
|||||||||
| Biogenic carbon removal from product |
kg CO2 |
0 |
0 |
0 |
0 |
0 |
0 |
0 |
0 |
| Biogenic carbon emission from product |
kg CO2 |
0 |
0 |
0 |
0 |
0 |
0 |
0 |
0 |
| Biogenic carbon removal from packaging |
kg CO2 |
0 |
0 |
8.15E+00 |
0 |
0 |
0 |
0 |
8.15E+00 |
| Biogenic carbon emission from packaging |
kg CO2 |
0 |
0 |
0 |
0 |
8.15E+00 |
0 |
0 |
8.15E+00 |
| Biogenic carbon emission from combustion of waste from renewable sources used in production processes |
kg CO2 |
0 |
0 |
0 |
0 |
0 |
0 |
0 |
0 |
| Calcination carbon emissions |
kg CO2 |
0 |
0 |
0 |
0 |
0 |
0 |
0 |
0 |
| Carbonation carbon removals |
kg CO2 |
0 |
0 |
0 |
0 |
0 |
0 |
0 |
0 |
| Carbon emissions from combustion of waste from renewable sources used in production processes |
kg CO2 |
0 |
0 |
0 |
0 |
0 |
0 |
0 |
0 |
| Carbon emissions from combustion of waste from non-renewable sources used in production processes |
kg CO2 |
0 |
0 |
0 |
0 |
0 |
0 |
0 |
0 |
StoneLite® granite panels: results per functional unit
| Parameter | Unit | A1 | A2 |
A3 |
A4 |
A5 |
C2 |
C4 |
Total |
| LCIA results |
|||||||||
| Ozone depletion |
kg CFC-11 eq |
8.55E-07 |
5.77E-06 |
1.67E-06 |
3.63E-07 |
1.33E-07 |
5.50E-07 |
3.86E-09 |
9.34E-06 |
| Global warming |
kg CO2 eq |
3.37E+01 |
2.96E+01 |
5.92E+01 |
1.82E+00 |
2.54E+00 |
2.74E+00 |
7.77E-01 |
1.30E+02 |
| Smog |
kg O3 eq |
2.07E+00 |
2.37E+00 |
1.80E+00 |
1.50E-01 |
1.68E-01 |
4.45E-01 |
7.44E-03 |
7.02E+00 |
| Acidification |
kg SO2 eq |
1.44E-01 |
9.07E-02 |
1.67E-01 |
5.71E-03 |
7.50E-03 |
1.51E-02 |
3.67E-04 |
4.31E-01 |
| Eutrophication |
kg N eq |
2.04E-02 |
1.21E-02 |
2.69E-02 |
7.68E-04 |
7.14E-04 |
1.55E-03 |
1.98E-03 |
6.44E-02 |
| Carcinogenics |
CTUh |
3.97E-07 |
1.24E-08 |
1.62E-07 |
7.56E-10 |
6.96E-09 |
7.83E-10 |
4.83E-09 |
5.85E-07 |
| Non-carcinogenics |
CTUh |
2.14E-06 |
1.16E-06 |
1.35E-06 |
6.84E-08 |
1.04E-07 |
1.31E-07 |
6.50E-09 |
4.96E-06 |
| Respiratory effects |
kg PM2.5 eq |
2.35E-02 |
5.84E-03 |
1.13E-02 |
3.58E-04 |
6.48E-04 |
1.76E-03 |
3.27E-05 |
4.34E-02 |
| Additional environmental information |
|||||||||
| Ecotoxicity |
CTUe |
4.07E+01 |
1.72E+01 |
7.17E+00 |
9.93E-01 |
4.45E-01 |
3.52E-01 |
2.40E-01 |
6.70E+01 |
| Fossil fuel depletion |
MJ surplus |
4.20E+01 |
5.66E+01 |
9.05E+01 |
3.49E+00 |
2.16E+00 |
5.28E+00 |
5.43E-02 |
2.00E+02 |
| Resource use indicators |
|||||||||
| Renewable primary energy used as energy carrier (fuel) |
MJ, LHV |
2.41E+01 |
6.48E-01 |
1.59E+02 |
3.97E-02 |
6.25E-01 |
5.94E-02 |
1.73E-02 |
1.85E+02 |
| Renewable primary resources with energy content used as material |
MJ, LHV |
4.22E-01 |
0 |
0 |
0 |
4.22E-03 |
0 |
0 |
4.26E-01 |
| Total use of renewable primary resources with energy content |
MJ, LHV |
2.45E+01 |
6.48E-01 |
1.59E+02 |
3.97E-02 |
6.29E-01 |
5.94E-02 |
1.73E-02 |
1.85E+02 |
| Non-renewable primary resources used as an energy carrier (fuel) |
MJ, LHV |
4.71E+02 |
3.96E+02 |
8.63E+02 |
2.44E+01 |
2.77E+01 |
3.69E+01 |
4.80E-01 |
1.82E+03 |
| Non-renewable primary resources with energy content used as material |
MJ, LHV |
1.20E-01 |
0 |
0 |
0 |
1.20E-03 |
0 |
0 |
1.21E-01 |
| Total use of non-renewable primary resources with energy content |
MJ, LHV |
4.72E+02 |
3.96E+02 |
8.63E+02 |
2.44E+01 |
2.77E+01 |
3.69E+01 |
4.80E-01 |
1.82E+03 |
| Secondary materials |
kg |
0 |
0 |
0 |
0 |
0 |
0 |
0 |
0 |
| Renewable secondary fuels |
MJ, LHV |
0 |
0 |
0 |
0 |
0 |
0 |
0 |
0 |
| Non-renewable secondary fuels |
MJ, LHV |
0 |
0 |
0 |
0 |
0 |
0 |
0 |
0 |
| Recovered energy |
MJ, LHV |
0 |
0 |
0 |
0 |
0 |
0 |
0 |
0 |
| Use of net fresh water resources |
m3 |
1.14E+02 |
1.89E+00 |
1.73E+01 |
1.14E-01 |
1.62E-01 |
1.70E-01 |
4.89E-02 |
1.34E+02 |
| Abiotic depletion potential for fossil resources |
MJ, LHV |
4.15E+02 |
3.20E+01 |
2.96E+01 |
6.08E+01 |
1.81E+00 |
2.60E+00 |
2.74E+00 |
5.45E+02 |
| Output flows and waste category indicators |
|||||||||
| Hazardous waste disposed |
kg |
3.24E-04 |
0 |
0 |
0 |
0 |
0 |
0 |
3.24E-04 |
| Non-hazardous waste disposed |
kg |
1.37E-02 |
0 |
1.09E+01 |
0 |
3.14E+00 |
0 |
5.48E+00 |
1.95E+01 |
| High-level radioactive waste, conditioned, to final repository |
kg |
1.13E-04 |
6.91E-06 |
3.47E-04 |
4.29E-07 |
2.40E-07 |
6.42E-07 |
1.86E-07 |
4.68E-04 |
| Intermediate- and low-level radioactive waste, conditioned, to final repository |
kg |
2.64E-04 |
1.54E-05 |
7.74E-04 |
9.57E-07 |
5.34E-07 |
1.43E-06 |
4.14E-07 |
1.06E-03 |
| Components for re-use |
kg |
0 |
0 |
0 |
0 |
0 |
0 |
0 |
0 |
| Materials for recycling |
kg |
5.96E+01 |
0 |
1.23E+01 |
0 |
9.44E-01 |
0 |
1.62E+01 |
8.90E+01 |
| Materials for energy recovery |
kg |
0 |
0 |
4.39E-01 |
0 |
7.23E-01 |
0 |
9.29E-02 |
1.25E+00 |
| Exported energy |
MJ, LHV |
0 |
0 |
0 |
0 |
0 |
0 |
0 |
0 |
| Carbon emissions and removals |
|||||||||
| Biogenic Carbon Removal from Product |
kg CO2 |
0 |
0 |
0 |
0 |
0 |
0 |
0 |
0 |
| Biogenic Carbon Emission from Product |
kg CO2 |
0 |
0 |
0 |
0 |
0 |
0 |
0 |
0 |
| Biogenic Carbon Removal from Packaging |
kg CO2 |
0 |
0 |
8.15E+00 |
0 |
0 |
0 |
0 |
8.15E+00 |
| Biogenic Carbon Emission from Packaging |
kg CO2 |
0 |
0 |
0 |
0 |
8.15E+00 |
0 |
0 |
8.15E+00 |
| Biogenic Carbon Emission from Combustion of Waste from Renewable Sources Used in Production Processes |
kg CO2 |
0 |
0 |
0 |
0 |
0 |
0 |
0 |
0 |
| Calcination Carbon Emissions |
kg CO2 |
0 |
0 |
0 |
0 |
0 |
0 |
0 |
0 |
| Carbonation Carbon Removals |
kg CO2 |
0 |
0 |
0 |
0 |
0 |
0 |
0 |
0 |
| Carbon Emissions from Combustion of Waste from Non-Renewable Sources used in Production Processes |
kg CO2 |
0 |
0 |
0 |
0 |
0 |
0 |
0 |
0 |
| Carbon Emissions from Combustion of Waste from Non-Renewable Sources used in Production Processes |
kg CO2 |
0 |
0 |
0 |
0 |
0 |
0 |
0 |
0 |
StoneLite® marble panels: results per functional unit
| Parameter | Unit | A1 | A2 |
A3 |
A4 |
A5 |
C2 |
C4 |
Total |
| LCIA results |
|||||||||
| Ozone depletion |
kg CFC-11 eq |
9.06E-07 |
2.85E-06 |
1.67E-06 |
3.55E-07 |
1.33E-07 |
5.35E-07 |
3.80E-09 |
6.45E-06 |
| Global warming |
kg CO2 eq |
3.66E+01 |
1.50E+01 |
5.91E+01 |
1.78E+00 |
2.54E+00 |
2.67E+00 |
7.77E-01 |
1.18E+02 |
| Smog |
kg O3 eq |
2.91E+00 |
1.17E+00 |
1.79E+00 |
1.47E-01 |
1.68E-01 |
4.33E-01 |
7.33E-03 |
6.62E+00 |
| Acidification |
kg SO2 eq |
1.73E-01 |
4.50E-02 |
1.65E-01 |
5.58E-03 |
7.50E-03 |
1.47E-02 |
3.63E-04 |
4.11E-01 |
| Eutrophication |
kg N eq |
2.24E-02 |
5.99E-03 |
2.71E-02 |
7.50E-04 |
7.13E-04 |
1.51E-03 |
1.98E-03 |
6.05E-02 |
| Carcinogenics |
CTUh |
4.51E-07 |
6.29E-09 |
1.62E-07 |
7.39E-10 |
6.96E-09 |
7.62E-10 |
4.83E-09 |
6.33E-07 |
| Non-carcinogenics |
CTUh |
2.46E-06 |
6.07E-07 |
1.35E-06 |
6.69E-08 |
1.04E-07 |
1.27E-07 |
6.49E-09 |
4.72E-06 |
| Respiratory effects |
kg PM2.5 eq |
2.44E-02 |
2.97E-03 |
1.12E-02 |
3.50E-04 |
6.47E-04 |
1.72E-03 |
3.23E-05 |
4.13E-02 |
| Additional environmental information |
|||||||||
| Ecotoxicity |
CTUe |
4.63E+01 |
9.21E+00 |
7.10E+00 |
9.71E-01 |
4.44E-01 |
3.43E-01 |
2.40E-01 |
6.46E+01 |
| Fossil fuel depletion |
MJ surplus |
4.66E+01 |
2.86E+01 |
9.03E+01 |
3.41E+00 |
2.16E+00 |
5.14E+00 |
5.35E-02 |
1.76E+02 |
| Resource use indicators |
|||||||||
| Renewable primary energy used as energy carrier (fuel) |
MJ, LHV |
3.07E+01 |
3.29E-01 |
1.59E+02 |
3.88E-02 |
6.25E-01 |
5.78E-02 |
1.72E-02 |
1.91E+02 |
| Renewable primary resources with energy content used as material |
MJ, LHV |
4.07E-01 |
0 |
0 |
0 |
4.07E-03 |
0 |
0 |
4.11E-01 |
| Total use of renewable primary resources with energy content |
MJ, LHV |
3.11E+01 |
3.29E-01 |
1.59E+02 |
3.88E-02 |
6.29E-01 |
5.78E-02 |
1.72E-02 |
1.91E+02 |
| Non-renewable primary resources used as an energy carrier (fuel) |
MJ, LHV |
5.13E+02 |
2.00E+02 |
8.59E+02 |
2.39E+01 |
2.76E+01 |
3.60E+01 |
4.75E-01 |
1.66E+03 |
| Non-renewable primary resources with energy content used as material |
MJ, LHV |
1.16E-01 |
0 |
0 |
0 |
1.16E-03 |
0 |
0 |
1.17E-01 |
| Total use of non-renewable primary resources with energy content |
MJ, LHV |
5.13E+02 |
2.00E+02 |
8.59E+02 |
2.39E+01 |
2.76E+01 |
3.60E+01 |
4.75E-01 |
1.66E+03 |
| Secondary materials |
kg |
0 |
0 |
0 |
0 |
0 |
0 |
0 |
0 |
| Renewable secondary fuels |
MJ, LHV |
0 |
0 |
0 |
0 |
0 |
0 |
0 |
0 |
| Non-renewable secondary fuels |
MJ, LHV |
0 |
0 |
0 |
0 |
0 |
0 |
0 |
0 |
| Recovered energy |
MJ, LHV |
0 |
0 |
0 |
0 |
0 |
0 |
0 |
0 |
| Use of net fresh water resources |
m3 |
1.19E+02 |
9.76E-01 |
1.73E+01 |
1.11E-01 |
1.62E-01 |
1.65E-01 |
4.89E-02 |
1.38E+02 |
| Abiotic depletion potential for fossil resources |
MJ, LHV |
4.15E+02 |
3.20E+01 |
1.50E+01 |
6.08E+01 |
1.77E+00 |
2.60E+00 |
2.67E+00 |
5.30E+02 |
| Output flows and waste category indicators |
|||||||||
| Hazardous waste disposed |
kg |
3.12E-04 |
0 |
0 |
0 |
0 |
0 |
0 |
3.12E-04 |
| Non-hazardous waste disposed |
kg |
1.32E-02 |
0 |
1.09E+01 |
0 |
3.14E+00 |
0 |
5.33E+00 |
1.94E+01 |
| High-level radioactive waste, conditioned, to final repository |
kg |
1.36E-04 |
3.47E-06 |
3.47E-04 |
4.20E-07 |
2.40E-07 |
6.24E-07 |
1.86E-07 |
4.88E-04 |
| Intermediate- and low-level radioactive waste, conditioned, to final repository |
kg |
3.02E-04 |
7.75E-06 |
7.74E-04 |
9.36E-07 |
5.34E-07 |
1.39E-06 |
4.14E-07 |
1.09E-03 |
| Components for re-use |
kg |
0 |
0 |
0 |
0 |
0 |
0 |
0 |
0 |
| Materials for recycling |
kg |
5.74E+01 |
0 |
1.18E+01 |
0 |
9.39E-01 |
0 |
1.58E+01 |
8.60E+01 |
| Materials for energy recovery |
kg |
0 |
0 |
4.39E-01 |
0 |
7.23E-01 |
0 |
9.29E-02 |
1.25E+00 |
| Exported energy |
MJ, LHV |
0 |
0 |
0 |
0 |
0 |
0 |
0 |
0 |
| Carbon emissions and removals |
|||||||||
| Biogenic Carbon Removal from Product |
kg CO2 |
0 |
0 |
0 |
0 |
0 |
0 |
0 |
0 |
| Biogenic Carbon Emission from Product |
kg CO2 |
0 |
0 |
0 |
0 |
0 |
0 |
0 |
0 |
| Biogenic Carbon Removal from Packaging |
kg CO2 |
0 |
0 |
8.15E+00 |
0 |
0 |
0 |
0 |
8.15E+00 |
| Biogenic Carbon Emission from Packaging |
kg CO2 |
0 |
0 |
0 |
0 |
8.15E+00 |
0 |
0 |
8.15E+00 |
| Biogenic Carbon Emission from Combustion of Waste from Renewable Sources Used in Production Processes |
kg CO2 |
0 |
0 |
0 |
0 |
0 |
0 |
0 |
0 |
| Calcination Carbon Emissions |
kg CO2 |
0 |
0 |
0 |
0 |
0 |
0 |
0 |
0 |
| Carbonation Carbon Removals |
kg CO2 |
0 |
0 |
0 |
0 |
0 |
0 |
0 |
0 |
| Carbon Emissions from Combustion of Waste from Non-Renewable Sources used in Production Processes |
kg CO2 |
0 |
0 |
0 |
0 |
0 |
0 |
0 |
0 |
| Carbon Emissions from Combustion of Waste from Non-Renewable Sources used in Production Processes |
kg CO2 |
0 |
0 |
0 |
0 |
0 |
0 |
0 |
0 |
StoneLite® porcelain panels: results per functional unit
| Parameter | Unit | A1 |
A2 |
A3 |
A4 |
A5 |
C2 |
C4 |
Total |
| LCIA results |
|||||||||
| Ozone depletion |
kg CFC-11 eq |
9.85E-07 |
4.42E-06 |
1.54E-06 |
3.28E-07 |
1.33E-07 |
4.86E-07 |
3.59E-09 |
7.89E-06 |
| Global warming |
kg CO2 eq |
4.09E+01 |
2.28E+01 |
5.42E+01 |
1.65E+00 |
2.54E+00 |
2.42E+00 |
7.75E-01 |
1.25E+02 |
| Smog |
kg O3 eq |
2.02E+00 |
1.82E+00 |
1.64E+00 |
1.36E-01 |
1.67E-01 |
3.93E-01 |
6.98E-03 |
6.18E+00 |
| Acidification |
kg SO2 eq |
1.55E-01 |
6.96E-02 |
1.48E-01 |
5.16E-03 |
7.48E-03 |
1.33E-02 |
3.51E-04 |
3.99E-01 |
| Eutrophication |
kg N eq |
2.20E-02 |
9.30E-03 |
2.66E-02 |
6.94E-04 |
7.12E-04 |
1.37E-03 |
1.98E-03 |
6.27E-02 |
| Carcinogenics |
CTUh |
4.03E-07 |
9.55E-09 |
1.55E-07 |
6.83E-10 |
6.96E-09 |
6.92E-10 |
4.83E-09 |
5.80E-07 |
| Non-carcinogenics |
CTUh |
2.75E-06 |
9.02E-07 |
1.23E-06 |
6.18E-08 |
1.04E-07 |
1.15E-07 |
6.48E-09 |
5.17E-06 |
| Respiratory effects |
kg PM2.5 eq |
1.80E-01 |
4.52E-03 |
1.03E-02 |
3.24E-04 |
6.45E-04 |
1.56E-03 |
3.07E-05 |
1.97E-01 |
| Additional environmental information |
|||||||||
| Ecotoxicity |
CTUe |
4.07E+01 |
1.35E+01 |
6.89E+00 |
8.97E-01 |
4.44E-01 |
3.11E-01 |
2.40E-01 |
6.30E+01 |
| Fossil fuel depletion |
MJ surplus |
5.28E+01 |
4.36E+01 |
8.27E+01 |
3.15E+00 |
2.16E+00 |
4.66E+00 |
5.11E-02 |
1.89E+02 |
| Resource use indicators |
|||||||||
| Renewable primary energy used as energy carrier (fuel) |
MJ, LHV |
2.94E+01 |
5.00E-01 |
1.50E+02 |
3.59E-02 |
6.27E-01 |
5.25E-02 |
1.72E-02 |
1.80E+02 |
| Renewable primary resources with energy content used as material |
MJ, LHV |
2.23E-01 |
0 |
0 |
0 |
2.23E-03 |
0 |
0 |
2.25E-01 |
| Total use of renewable primary resources with energy content |
MJ, LHV |
2.96E+01 |
5.00E-01 |
1.50E+02 |
3.59E-02 |
6.29E-01 |
5.25E-02 |
1.72E-02 |
1.81E+02 |
| Non-renewable primary resources used as an energy carrier (fuel) |
MJ, LHV |
5.74E+02 |
3.06E+02 |
7.79E+02 |
2.21E+01 |
2.76E+01 |
3.26E+01 |
4.58E-01 |
1.74E+03 |
| Non-renewable primary resources with energy content used as material |
MJ, LHV |
6.34E-02 |
0 |
0 |
0 |
6.34E-04 |
0 |
0 |
6.40E-02 |
| Total use of non-renewable primary resources with energy content |
MJ, LHV |
5.74E+02 |
3.06E+02 |
7.79E+02 |
2.21E+01 |
2.76E+01 |
3.26E+01 |
4.58E-01 |
1.74E+03 |
| Secondary materials |
kg |
0 |
0 |
0 |
0 |
0 |
0 |
0 |
0 |
| Renewable secondary fuels |
MJ, LHV |
0 |
0 |
0 |
0 |
0 |
0 |
0 |
0 |
| Non-renewable secondary fuels |
MJ, LHV |
0 |
0 |
0 |
0 |
0 |
0 |
0 |
0 |
| Recovered energy |
MJ, LHV |
0 |
0 |
0 |
0 |
0 |
0 |
0 |
0 |
| Use of net fresh water resources |
m3 |
1.47E+02 |
1.47E+00 |
1.64E+01 |
1.03E-01 |
1.62E-01 |
1.50E-01 |
4.88E-02 |
1.65E+02 |
| Abiotic depletion potential for fossil resources |
MJ, LHV |
4.16E+02 |
3.20E+01 |
2.29E+01 |
5.59E+01 |
1.63E+00 |
2.60E+00 |
2.42E+00 |
5.33E+02 |
| Output flows and waste category indicators |
|||||||||
| Hazardous waste disposed |
kg |
1.71E-04 |
0 |
0 |
0 |
0 |
0 |
0 |
1.71E-04 |
| Non-hazardous waste disposed |
kg |
7.23E-03 |
0 |
1.09E+01 |
0 |
3.13E+00 |
0 |
4.83E+00 |
1.88E+01 |
| High-level radioactive waste, conditioned, to final repository |
kg |
1.39E-04 |
5.32E-06 |
3.04E-04 |
3.88E-07 |
2.39E-07 |
5.67E-07 |
1.85E-07 |
4.50E-04 |
| Intermediate- and low-level radioactive waste, conditioned, to final repository |
kg |
3.44E-04 |
1.19E-05 |
6.80E-04 |
8.65E-07 |
5.32E-07 |
1.26E-06 |
4.13E-07 |
1.04E-03 |
| Components for re-use |
kg |
0 |
0 |
0 |
0 |
0 |
0 |
0 |
0 |
| Materials for recycling |
kg |
3.14E+01 |
0 |
0.00E+00 |
0 |
9.25E-01 |
0 |
1.43E+01 |
4.66E+01 |
| Materials for energy recovery |
kg |
0 |
0 |
4.39E-01 |
0 |
7.23E-01 |
0 |
9.29E-02 |
1.25E+00 |
| Exported energy |
MJ, LHV |
0 |
0 |
0 |
0 |
0 |
0 |
0 |
0 |
| Carbon emissions and removals |
|||||||||
| Biogenic Carbon Removal from Product |
kg CO2 |
0 |
0 |
0 |
0 |
0 |
0 |
0 |
0 |
| Biogenic Carbon Emission from Product |
kg CO2 |
0 |
0 |
0 |
0 |
0 |
0 |
0 |
0 |
| Biogenic Carbon Removal from Packaging |
kg CO2 |
0 |
0 |
8.15E+00 |
0 |
0 |
0 |
0 |
8.15E+00 |
| Biogenic Carbon Emission from Packaging |
kg CO2 |
0 |
0 |
0 |
0 |
8.15E+00 |
0 |
0 |
8.15E+00 |
| Biogenic Carbon Emission from Combustion of Waste from Renewable Sources Used in Production Processes |
kg CO2 |
0 |
0 |
0 |
0 |
0 |
0 |
0 |
0 |
| Calcination Carbon Emissions |
kg CO2 |
0 |
0 |
0 |
0 |
0 |
0 |
0 |
0 |
| Carbonation Carbon Removals |
kg CO2 |
0 |
0 |
0 |
0 |
0 |
0 |
0 |
0 |
| Carbon Emissions from Combustion of Waste from Non-Renewable Sources used in Production Processes |
kg CO2 |
0 |
0 |
0 |
0 |
0 |
0 |
0 |
0 |
| Carbon Emissions from Combustion of Waste from Non-Renewable Sources used in Production Processes |
kg CO2 |
0 |
0 |
0 |
0 |
0 |
0 |
0 |
0 |