EPD additional content Chinaware CT728CU
Data
Background This product-average plant-specific declaration was created by collecting production data from the India plant. All unit processes were modeled using primary data. Secondary data sources include those available in ecoinvent and USLCI databases. Literature data was used to fill any data gaps to complete the inventory.
In the manufacturing of the products, secondary materials such as scrap metals and metal bars used to hold the primary products in place were partially incorporated in the manufacturing of the primary products but were not considered due to a lack of background data in the LCA model.
Allocation Allocations of multi-input and multi-output processes follow a mass-based approach in the collected data, which is the most appropriate for the unit processes modeled. Allocation approaches in the background data follow the ecoinvent methodology. No co-product allocations were made in the model.
Cut-off criteria for the inclusion of mass and energy flows are 1% of renewable primary resource (energy) usage, 1% nonrenewable primary resource (energy) usage, 1% of the total mass input of that unit process, and 1% of environmental impacts. The total of neglected input flows per module does not exceed 5% of energy usage, mass, and environmental impacts. The only exceptions to these criteria are substances with hazardous and toxic properties, which must be listed even when the given process unit is under the cut-off criterion of 1% of the total mass.
Non-ceramic parts in toilets include the spud nut and washer. All parts with a weight of >1% weight of all parts (excluding ceramic and packaging materials) are included in the LCA model; no substances considered to be hazardous or toxic according to local regulations are present in the product. A check was performed to ensure that the completeness of the overall material use is >99.0wt% of the finished product after cut-off, including the ceramic and packaging materials.
Data quality assessment
Precision: The precision of the data is considered high. Product engineers provided detailed bills of materials, and facility managers provided utility information for the manufacturing facilities. The raw material transportation distances were calculated based on the raw material manufacturers’ addresses, extracted from the relevant SDSs. Proxy datasets were utilized in the LCA model when secondary data were not available, as shown in Appendix A in the published LCA background report.
Completeness: The data included is considered complete. The LCA model included all known material and energy flows. As pointed out in that section, no known flows above 1% were excluded and the sum of all excluded flows totals less than 5%, whether evaluated by mass, energy, or potential environmental impact.
Consistency: The consistency of the model is considered high. The bills of materials provided by the product engineers were developed for multiple internal departments use and are maintained regularly. The LCA practitioner also cross-referenced the installation documents and other relevant information to ensure consistency. Furthermore, modeling assumptions were consistent across the model, with preference given towards SimaPro data, where available.
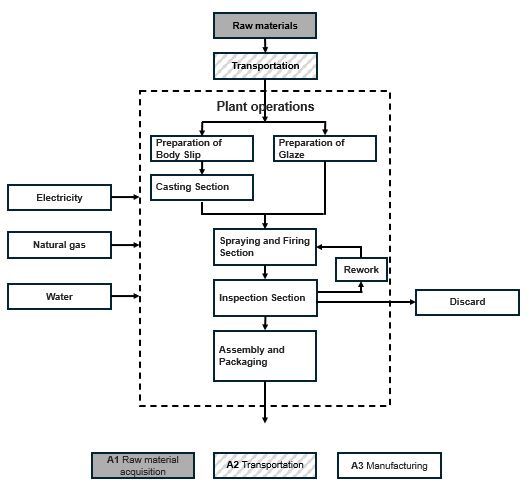
Flow diagram
Scenarios and additional technical information
Distribution [A4]
| Plant location | Fairburn, GA |
| Distance (port of Savannah to plant) | 406 km |
| Vehicle type | Diesel truck |
In 2023, outbound shipments of CT728 from Fairburn were transported an average of 947 miles (1,524 km) by diesel truck and an average of 1,114 miles (1,793 km) by rail. The quantity transported by truck is 95%, and by rail 5%.
Installation [A5]
A 0.15kg wax ring was accounted for in this study. These are necessary for creating a seal between the toilet outlet and drain line.
Use stage [B1-B5]
The toilets are assumed to have a useful life of 30 years. As a result, an additional 1.5 products are included as replacements, with all life cycle modules considered, over the building's ESL of 75 years.
End-of-life stage [C1-C4]
The model reflects the assumptions that toilets are 100% landfilled. The product is assumed to be transported 100 km via truck to final disposal.
However, it should be noted that many of the associated metal and plastic components follow the waste scenarios as listed in the table below. TOTO ceramic materials can be recycled as aggregate in several applications, although this is not currently common practice. Secondary materials, including shredded and sorted metal waste, are valuable goods that lose their status as waste after the sorting process. No additional waste processing is needed in that case, and no credits for material recovery are given.
| Material | Potential waste scenario - Recycling |
Potential waste scenario - Landfill |
| Brass, zinc | 70.5% | 29.5% |
| Ceramic | 0.00% | 100% |
| Corrugated board, paper | 66.5% | 33.5% |
| Pallet | 14.5% | 85.5% |
| SBR, EPDM rubber, silicone rubber, ABS, POM | 15.0% | 85.0% |
Product information
| Product code | ASTM or ANSI product specification | Physical properties and technical information |
| CT728CU(V)(G)(X) | ASME A112.19.2/CSA B45.1 Certifications: IAPMO(cUPC) | Vitreous china plumbing fixture |
Major system boundary exclusions
- Construction of major capital equipment
- Construction of water and wastewater infrastructure
- Maintenance and operation of support equipment
- Human labor and employee transport
- Manufacture and transport of packaging materials not associated with final product
- Energy consumption in warehouses, distribution centers, and retail facilities during the course of transport to the final customer
- Disposal of packaging materials not associated with final product
- Building operational energy and water use
Major assumptions and limitations
- Transportation of all raw materials with the mass above 1% of the cumulative mass of the model, products from vendors, is estimate based on rail lines, port information. The worst case scenario of the furthest distance from each factory to the manufacturing facility to transport kaolin with ocean freight method was considered.
- Water content of sludge was measured and reported; however, this measurement not performed routinely.
- Pallet use is assumed based on the average numbers per unit of product and reported pallet quantity of specific models.
LCIA results, resource use, output and waste flows, and carbon emissions & removals per functional unit
| Parameter | Unit |
A1-A3 | A4 |
A5 |
B1 |
B2 |
B3 |
B4 |
B5-B7, C1 |
C2 |
C3 |
C4 |
Total |
| LCIA results |
|||||||||||||
| Ozone depletion |
kg CFC-11 eq |
3.55E-06 |
3.64E-08 |
2.86E-08 |
0 |
2.48E-06 |
0 |
1.45E-05 |
0 |
6.46E-10 |
5.75E-09 |
8.01E-08 |
2.07E-05 |
| Global warming |
kg CO2 eq |
2.08E+02 |
1.26E+01 |
7.59E-01 |
0 |
3.96E+01 |
0 |
7.04E+02 |
0 |
3.66E-01 |
1.05E-01 |
4.83E-01 |
9.66E+02 |
| Smog |
kg O3 eq |
8.06E+00 |
5.26E+00 |
1.01E+01 |
0 |
1.94E+00 |
0 |
9.52E+01 |
0 |
5.83E-02 |
1.01E+01 |
1.01E+01 |
1.41E+02 |
| Acidification |
kg SO2 eq |
4.76E-01 |
1.78E-01 |
2.84E-01 |
0 |
2.24E-01 |
0 |
3.73E+00 |
0 |
2.03E-03 |
2.84E-01 |
2.85E-01 |
5.46E+00 |
| Eutrophication |
kg N eq |
7.86E-02 |
1.03E-02 |
1.89E-02 |
0 |
2.49E-02 |
0 |
3.94E-01 |
0 |
1.32E-04 |
1.80E-02 |
1.82E-02 |
5.63E-01 |
| Respiratory effects |
kg PM2.5 eq |
4.39E-02 |
2.86E-03 |
2.98E-03 |
0 |
1.89E-02 |
0 |
4.30E-01 |
0 |
3.16E-05 |
2.99E-03 |
3.10E-03 |
5.05E-01 |
| Additional environmental information |
|||||||||||||
| Carcinogenics |
CTUh |
3.00E-06 |
1.72E-07 |
9.16E-09 |
0 |
7.87E-07 |
0 |
1.05E-05 |
0 |
5.06E-09 |
9.85E-09 |
1.02E-08 |
1.45E-05 |
| Non carcinogenics |
CTUh |
2.82E-05 |
1.61E-06 |
8.51E-08 |
0 |
7.73E-06 |
0 |
9.70E-05 |
0 |
4.72E-08 |
8.72E-08 |
9.19E-08 |
1.35E-04 |
| Ecotoxicity |
CTUe |
1.08E+02 |
3.07E+01 |
1.56E+00 |
0 |
1.89E+01 |
0 |
7.04E+02 |
0 |
9.00E-01 |
1.55E+00 |
1.83E+00 |
8.67E+02 |
| Fossil fuel depletion |
MJ surplus |
1.29E+02 |
2.21E+01 |
1.32E+00 |
0 |
1.09E+02 |
0 |
5.92E+02 |
0 |
6.47E-01 |
1.10E+00 |
1.79E+00 |
8.57E+02 |
| Resource use indicators |
|||||||||||||
| Renewable primary energy used as energy carrier (fuel) |
MJ, LHV |
3.61E+02 |
-2.46E+01 |
-2.39E+01 |
0 |
4.74E+01 |
0 |
1.04E+03 |
0 |
-2.43E+01 |
-6.42E+01 |
-2.49E+01 |
1.29E+03 |
| Renewable primary resources with energy content used as material |
MJ, LHV |
1.28E+02 |
2.49E+01 |
2.49E+01 |
0 |
2.49E+01 |
0 |
4.75E+02 |
0 |
2.44E+01 |
6.43E+01 |
2.49E+01 |
7.91E+02 |
| Total use of renewable primary resources with energy content |
MJ, LHV |
4.89E+02 |
3.45E-01 |
1.02E+00 |
0 |
7.23E+01 |
0 |
1.52E+03 |
0 |
1.05E-02 |
1.96E-02 |
3.42E-02 |
2.08E+03 |
| Non-renewable primary resources used as an energy carrier (fuel) |
MJ, LHV |
1.47E+03 |
1.67E+02 |
8.84E+00 |
0 |
1.00E+03 |
0 |
6.20E+03 |
0 |
3.62E+00 |
8.27E+00 |
1.24E+01 |
8.87E+03 |
| Non-renewable primary resources with energy content used as material |
MJ, LHV |
6.77E+00 |
1.32E+00 |
1.32E+00 |
0 |
1.32E+00 |
0 |
2.00E+01 |
0 |
1.32E+00 |
0 |
1.32E+00 |
3.34E+01 |
| Total use of non-renewable primary resources with energy content |
MJ, LHV |
1.47E+03 |
1.68E+02 |
1.02E+01 |
0 |
1.00E+03 |
0 |
6.22E+03 |
0 |
4.93E+00 |
8.27E+00 |
1.37E+01 |
8.90E+03 |
| Secondary materials |
kg |
0 |
0 |
0 |
0 |
0 |
0 |
0 |
0 |
0 |
0 |
0 |
0 |
| Renewable secondary fuels |
MJ, LHV |
0 |
0 |
0 |
0 |
0 |
0 |
0 |
0 |
0 |
0 |
0 |
0 |
| Non-renewable secondary fuels |
MJ, LHV |
0 |
0 |
0 |
0 |
0 |
0 |
0 |
0 |
0 |
0 |
0 |
0 |
| Recovered energy |
MJ, LHV |
0 |
0 |
0 |
0 |
0 |
0 |
0 |
0 |
0 | 0 |
0 |
0 |
| Use of net fresh water resources |
m3 |
5.75E-05 |
1.50E-03 |
1.03E-02 |
0 |
8.37E-04 |
0 |
1.09E-02 |
0 |
4.33E-04 |
9.22E-03 |
4.87E-04 |
3.37E-02 |
| Output flows and waste category indicators |
|||||||||||||
| Hazardous waste disposed |
kg |
3.38E-03 |
0 |
0 |
0 |
0 |
0 |
0 |
0 |
0 |
0 |
0 |
3.38E-03 |
| Non-hazardous waste disposed |
kg |
2.99E+01 |
1.20E+00 |
1.43E+00 |
0 |
2.93E+01 |
0 |
1.32E+02 |
0 |
5.40E-01 |
0 |
2.58E+01 |
2.20E+02 |
| High-level radioactive waste, conditioned, to final repository |
kg |
5.82E-03 |
4.43E-05 |
2.02E-04 |
0 |
3.81E-03 |
0 |
2.29E-02 |
0 |
9.60E-07 |
1.15E-05 |
4.06E-06 |
3.28E-02 |
| Intermediate- and low-level radioactive waste, conditioned, to final repository |
kg |
3.47E-05 |
2.89E-07 |
9.98E-08 |
0 |
8.86E-06 |
0 |
1.18E-04 |
0 |
9.18E-09 |
2.75E-08 |
2.26E-08 |
1.62E-04 |
| Components for re-use |
kg |
0 |
0 |
0 |
0 |
0 |
0 |
0 |
0 |
0 |
0 |
0 |
0 |
| Materials for recycling |
kg |
0 |
0 |
0 |
0 |
2.93E+01 |
0 |
4.49E+01 |
0 |
2.20E-01 |
2.20E-01 |
2.20E-01 |
7.49E+01 |
| Materials for energy recovery |
kg |
0 |
0 |
0 |
0 |
0 |
0 |
0 |
0 |
0 |
0 |
0 |
0 |
| Exported energy |
MJ, LHV |
0 |
0 |
0 |
0 |
0 |
0 |
0 |
0 |
0 |
0 |
0 |
0 |
| Carbon emissions and removals |
|||||||||||||
| Biogenic Carbon Removal from Product |
kg CO2 |
0 |
0 |
0 |
0 |
0 |
0 |
0 |
0 |
0 |
0 |
0 |
0 |
| Biogenic Carbon Emission from Product |
kg CO2 |
0 |
0 |
0 |
0 |
0 |
0 |
0 |
0 |
0 |
0 |
0 |
0 |
| Biogenic Carbon Removal from Packaging |
kg CO2 |
1.43E+00 |
0 |
0 |
0 |
0 |
0 |
0 |
0 |
0 |
0 |
0 |
1.43E+00 |
| Biogenic Carbon Emission from Packaging |
kg CO2 |
0 |
0 |
1.43E+00 |
0 |
0 |
0 |
0 |
0 |
0 |
0 |
0 |
1.43E+00 |
| Biogenic Carbon Emission from Combustion of Waste from Renewable Sources Used in Production Processes |
kg CO2 |
0 |
0 |
0 |
0 |
0 |
0 |
0 |
0 |
0 |
0 |
0 |
0 |
| Calcination Carbon Emissions |
kg CO2 |
0 |
0 |
0 |
0 |
0 |
0 |
0 |
0 |
0 |
0 |
0 |
0 |
| Carbonation Carbon Removals |
kg CO2 |
0 |
0 |
0 |
0 |
0 |
0 |
0 |
0 |
0 |
0 |
0 |
0 |
| Carbon Emissions from Combustion of Waste from Renewable and Non-Renewable Sources used in Production Processes |
kg CO2 |
0 |
0 |
0 |
0 |
0 |
0 |
0 |
0 |
0 |
0 |
0 |
0 |