EPD additional content AIR-SHIELD™
Data
Background This product-specific plant-specific declaration was created by collecting production data from the facility in Hampshire, IL. All unit processes were modeled using primary data. Secondary data sources include those available in the ecoinvent v3.10 and US-EI 2.2 databases.
Product-specific packaging includes poly bags which are typically disposed of at the site of installation.
Allocation The W. R. MEADOWS facility produces multiple types of products each year. To allocate electricity and natural gas consumption accurately to each product, total annual energy consumption was distributed based on the proportion of each product's annual production (by mass) relative to the total plant production. This approach assigns manufacturing activities proportionally to each product type.
All associated manufacturing resources and waste flows were allocated using the same approach. There are no co‐products produced during their manufacturing processes. The model used in the LCA ensures that the sum of the allocated inputs and outputs of a unit process shall be equal to the inputs and outputs of the unit process before allocation. This means that no double counting or omissions of inputs or outputs through allocation is occurring.
Cut-off criteria for the inclusion of mass and energy flows are 1% of renewable primary resource (energy) usage, 1% nonrenewable primary resource (energy) usage, 1% of the total mass input of that unit process, and 1% of environmental impacts. The total of neglected input flows per module does not exceed 5% of energy usage, mass, and environmental impacts.
The only exceptions to these criteria are substances with hazardous and toxic properties, which must be listed even when the given process unit is under the cut-off criterion of 1% of the total mass. No known flows are deliberately excluded from this declaration, and no substances considered to be hazardous or toxic according to the Resource Conservation and Recovery Act (RCRA), Subtitle C are present in the products. Therefore, these criteria have been met. Biogenic carbon is included in reported results.
Quality
The precision of the data is considered high. W. R. MEADOWS personnel provided a detailed bill of materials, and facility managers provided utility information for the manufacturing facility. The raw material transportation distances were provided directly by the facility.
The data included is considered complete. The LCA model included all known material and energy flows. As pointed out in that section, no known flows above 1% were excluded and the sum of all excluded flows totals less than 5%, whether evaluated by mass, energy, or potential environmental impact.
The consistency of the model is considered high. Furthermore, the modeling assumptions were consistent throughout the model, with a preference for the ecoinvent v3.10 database.
Major system boundary exclusions
- Manufacture and transport of packaging not associated with final product
- Construction of major capital equipment
- Maintenance and operation of support equipment
- Human labor and employee transport
- Disposal of final product, except for biogenic carbon balance reporting
Scenarios and additional technical information
Biogenic carbon disclosure in installation stage [A5] While the impacts from installation are out of the scope of this cradle-to-gate study, ISO 21930:2017 requires that biogenic carbon emissions associated with packaging disposed of after product installation are separately reported. The biogenic carbon removals from packaging in the manufacturing stage (A3) are later accounted for as biogenic carbon emissions in the installation stage (A5).
Product name |
Biogenic carbon emission from packaging (A5) |
AIR-SHIELD |
5.48E-01 Kg CO2 |
AIR-SHIELD THRU-WALL FLASHING |
5.48E-01 Kg CO2 |
AIR-SHIELD LOW TEMP |
6.93E-01 Kg CO2 |
AIR-SHIELD XLT |
4.18E-01 Kg CO2 |
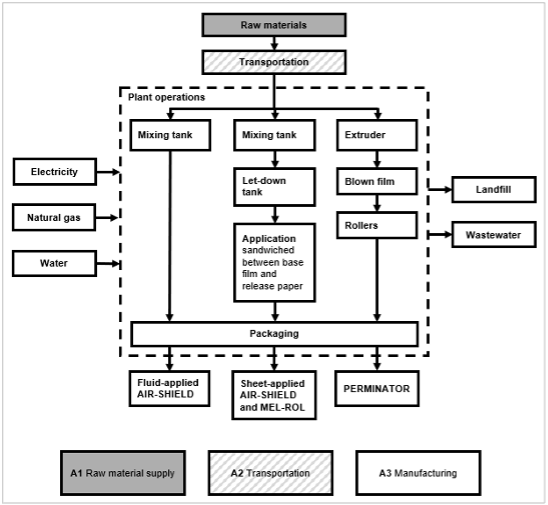
Flow diagram
Major assumptions and limitations
- Generic data sets used for material inputs, transport, and waste processing are considered good quality, but actual impacts from material suppliers, transport carriers, and local waste processing may vary
- The impact assessment methodology categories do not represent all possible environmental impact categories; characterization factors used within the impact assessment methodology may contain varying levels of uncertainty
- LCA results are relative expressions and do not predict impacts on category endpoints, the exceeding of thresholds, safety margins, or risks
- This EPD covers only the cradle-to-gate impacts of products using a declared unit. The results listed in this EPD cannot be used to compare between products.
LCIA impact factors required by the PCR are global warming, ozone depletion potential, acidification, eutrophication, smog, and fossil fuel depletion. The EPDs from different programs shall not be comparable.
LCIA results, resource use, output and waste flows, and carbon emissions & removals per declared unit (1m2) of AIR-SHIELD™
Parameter |
Unit |
A1 |
A2 |
A3 |
Total |
LCIA results |
|||||
GWP, IPCCTOTAL |
kg CO2 eq |
1.22E+00 |
1.05E-01 |
1.98E-01 |
1.52E+00 |
GWP, IPCCBIOGENIC |
kg CO2 eq |
-1.39E-02 |
0 |
1.39E-02 |
0 |
GWP, IPCCFOSSIL |
kg CO2 eq |
1.23E+00 |
1.05E-01 |
1.84E-01 |
1.52E+00 |
GWP, TRACI 2.1TOTAL |
kg CO2 eq |
1.19E+00 |
1.04E-01 |
2.04E-01 |
1.50E+00 |
GWP, TRACI 2.1BIOGENIC |
kg CO2 eq |
-1.39E-02 |
0 |
1.39E-02 |
0 |
GWP, TRACI 2.1FOSSIL |
kg CO2 eq |
1.21E+00 |
1.04E-01 |
1.90E-01 |
1.50E+00 |
Ozone depletion |
kg CFC-11 eq |
3.39E-07 |
1.49E-09 |
7.59E-09 |
3.48E-07 |
Acidification |
kg SO2 eq |
4.62E-03 |
2.56E-04 |
9.52E-04 |
5.83E-03 |
Eutrophication |
kg N eq |
8.34E-04 |
1.74E-05 |
3.31E-04 |
1.18E-03 |
Smog |
kg O3 eq |
6.24E-02 |
6.58E-03 |
1.62E-02 |
8.52E-02 |
Respiratory effects |
kg PM2.5 eq |
7.35E-04 |
3.53E-05 |
1.78E-04 |
9.48E-04 |
Additional environmental information |
|||||
Carcinogenics |
CTUh |
71.69% |
1.02% |
27.29% |
100% |
Non-carcinogenics |
CTUh |
44.79% |
8.36% |
46.86% |
100% |
Ecotoxicity |
CTUe |
83.34% |
8.72% |
7.95% |
100% |
Fossil fuel depletion |
MJ surplus |
4.54E+00 |
1.98E-01 |
2.22E-01 |
4.96E+00 |
Resource use indicators |
|||||
Renewable primary energy used as energy carrier (fuel) |
MJ, NCV |
7.50E+00 |
2.28E-03 |
5.82E+00 |
1.33E+01 |
Renewable primary resources with energy content used as material |
MJ, NCV |
4.48E+00 |
0 |
0 |
4.48E+00 |
Total use of renewable primary resources with energy content |
MJ, NCV |
1.20E+01 |
2.28E-03 |
5.82E+00 |
1.78E+01 |
Non-renewable primary resources used as an energy carrier (fuel) |
MJ, NCV |
1.22E+01 |
1.49E+00 |
2.56E+00 |
1.62E+01 |
Non-renewable primary resources with energy content used as material |
MJ, NCV |
2.55E+01 |
0 |
0 |
2.55E+01 |
Total use of non-renewable primary resources with energy content |
MJ, NCV |
3.77E+01 |
1.49E+00 |
2.56E+00 |
4.17E+01 |
Secondary materials |
kg |
0 |
0 |
0 |
0 |
Renewable secondary fuels |
MJ, NCV |
0 |
0 |
0 |
0 |
Non-renewable secondary fuels |
MJ, NCV |
0 |
0 |
0 |
0 |
Recovered energy |
MJ, NCV |
0 |
0 |
0 |
0 |
Use of net fresh water resources |
m3 |
2.40E+00 |
1.11E-02 |
5.87E-01 |
2.99E+00 |
Abiotic depletion (fossil fuels) |
MJ, LHV |
3.46E+01 |
1.40E+00 |
2.17E+00 |
3.82E+01 |
Output flows and waste category indicators |
|||||
Hazardous waste disposed |
kg |
2.33E-02 |
3.25E-04 |
1.02E-02 |
3.38E-02 |
Non-hazardous waste disposed |
kg |
1.50E+00 |
1.29E-03 |
6.43E-02 |
1.57E+00 |
High-level radioactive waste, conditioned, to final repository |
kg |
9.19E-07 |
0 |
4.53E-06 |
5.45E-06 |
Intermediate- and low-level radioactive waste, conditioned, to final repository |
kg |
2.12E-06 |
7.08E-08 |
1.11E-05 |
1.33E-05 |
Components for re-use |
kg |
0 |
0 |
0 |
0 |
Materials for recycling |
kg |
0 |
0 |
0 |
0 |
Materials for energy recovery |
kg |
0 |
0 |
0 |
0 |
Exported energy |
MJ |
0 |
0 |
0 |
0 |
Carbon emissions and removals |
|||||
Biogenic carbon removal from product |
kg CO2 |
0 |
0 |
0 |
0 |
Biogenic carbon emission from product |
kg CO2 |
0 |
0 |
0 |
0 |
Biogenic carbon removal from packaging |
kg CO2 |
-1.39E-02 |
0 |
-5.48E-01 |
-5.61E-01 |
Biogenic carbon emission from packaging |
kg CO2 |
0 |
0 |
1.39E-02 |
1.39E-02 |
Biogenic carbon emission from combustion of waste from renewable sources used in production processes |
kg CO2 |
0 |
0 |
0 |
0 |
Calcination carbon emissions |
kg CO2 |
0 |
0 |
0 |
0 |
Carbonation carbon removals |
kg CO2 |
0 |
0 |
0 |
0 |
Carbon emissions from combustion of waste from non-renewable sources used in production processes |
kg CO2 |
0 |
0 |
0 |
0 |
LCIA results, resource use, output and waste flows, and carbon emissions & removals per declared unit (1m2) of AIR-SHIELD™ THRU WALL FLASHING TAPE
Parameter |
Unit |
A1 |
A2 |
A3 |
Total |
LCIA results |
|||||
GWP, IPCCTOTAL |
kg CO2 eq |
1.22E+00 |
1.05E-01 |
1.98E-01 |
1.52E+00 |
GWP, IPCCBIOGENIC |
kg CO2 eq |
-1.39E-02 |
0 |
1.39E-02 |
0 |
GWP, IPCCFOSSIL |
kg CO2 eq |
1.23E+00 |
1.05E-01 |
1.84E-01 |
1.52E+00 |
GWP, TRACI 2.1TOTAL |
kg CO2 eq |
1.19E+00 |
1.04E-01 |
2.04E-01 |
1.50E+00 |
GWP, TRACI 2.1BIOGENIC |
kg CO2 eq |
-1.39E-02 |
0 |
1.39E-02 |
0 |
GWP, TRACI 2.1FOSSIL |
kg CO2 eq |
1.21E+00 |
1.04E-01 |
1.90E-01 |
1.50E+00 |
Ozone depletion |
kg CFC-11 eq |
3.39E-07 |
1.49E-09 |
7.59E-09 |
3.48E-07 |
Acidification |
kg SO2 eq |
4.62E-03 |
2.56E-04 |
9.52E-04 |
5.83E-03 |
Eutrophication |
kg N eq |
8.34E-04 |
1.74E-05 |
3.31E-04 |
1.18E-03 |
Smog |
kg O3 eq |
6.24E-02 |
6.58E-03 |
1.62E-02 |
8.52E-02 |
Respiratory effects |
kg PM2.5 eq |
7.35E-04 |
3.53E-05 |
1.78E-04 |
9.48E-04 |
Additional environmental information |
|||||
Carcinogenics |
CTUh |
71.69% |
1.02% |
27.29% |
100% |
Non-carcinogenics |
CTUh |
44.79% |
8.36% |
46.86% |
100% |
Ecotoxicity |
CTUe |
83.34% |
8.72% |
7.95% |
100% |
Fossil fuel depletion |
MJ surplus |
4.54E+00 |
1.98E-01 |
2.22E-01 |
4.96E+00 |
Resource use indicators |
|||||
Renewable primary energy used as energy carrier (fuel) |
MJ, NCV |
7.50E+00 |
2.28E-03 |
5.82E+00 |
1.33E+01 |
Renewable primary resources with energy content used as material |
MJ, NCV |
4.48E+00 |
0 |
0 |
4.48E+00 |
Total use of renewable primary resources with energy content |
MJ, NCV |
1.20E+01 |
2.28E-03 |
5.82E+00 |
1.78E+01 |
Non-renewable primary resources used as an energy carrier (fuel) |
MJ, NCV |
1.22E+01 |
1.49E+00 |
2.56E+00 |
1.62E+01 |
Non-renewable primary resources with energy content used as material |
MJ, NCV |
2.55E+01 |
0 |
0 |
2.55E+01 |
Total use of non-renewable primary resources with energy content |
MJ, NCV |
3.77E+01 |
1.49E+00 |
2.56E+00 |
4.17E+01 |
Secondary materials |
kg |
0 |
0 |
0 |
0 |
Renewable secondary fuels |
MJ, NCV |
0 |
0 |
0 |
0 |
Non-renewable secondary fuels |
MJ, NCV |
0 |
0 |
0 |
0 |
Recovered energy |
MJ, NCV |
0 |
0 |
0 |
0 |
Use of net fresh water resources |
m3 |
2.40E+00 |
1.11E-02 |
5.87E-01 |
2.99E+00 |
Abiotic depletion (fossil fuels) |
MJ, LHV |
3.46E+01 |
1.40E+00 |
2.17E+00 |
3.82E+01 |
Output flows and waste category indicators |
|||||
Hazardous waste disposed |
kg |
2.33E-02 |
3.25E-04 |
1.02E-02 |
3.38E-02 |
Non-hazardous waste disposed |
kg |
1.50E+00 |
1.29E-03 |
6.43E-02 |
1.57E+00 |
High-level radioactive waste, conditioned, to final repository |
kg |
9.19E-07 |
0 |
4.53E-06 |
5.45E-06 |
Intermediate- and low-level radioactive waste, conditioned, to final repository |
kg |
2.12E-06 |
7.08E-08 |
1.11E-05 |
1.33E-05 |
Components for re-use |
kg |
0 |
0 |
0 |
0 |
Materials for recycling |
kg |
0 |
0 |
0 |
0 |
Materials for energy recovery |
kg |
0 |
0 |
0 |
0 |
Exported energy |
MJ |
0 |
0 |
0 |
0 |
Carbon emissions and removals |
|||||
Biogenic carbon removal from product |
kg CO2 |
0 |
0 |
0 |
0 |
Biogenic carbon emission from product |
kg CO2 |
0 |
0 |
0 |
0 |
Biogenic carbon removal from packaging |
kg CO2 |
-1.39E-02 |
0 |
-5.48E-01 |
-5.61E-01 |
Biogenic carbon emission from packaging |
kg CO2 |
0 |
0 |
1.39E-02 |
1.39E-02 |
Biogenic carbon emission from combustion of waste from renewable sources used in production processes |
kg CO2 |
0 |
0 |
0 |
0 |
Calcination carbon emissions |
kg CO2 |
0 |
0 |
0 |
0 |
Carbonation carbon removals |
kg CO2 |
0 |
0 |
0 |
0 |
Carbon emissions from combustion of waste from non-renewable sources used in production processes |
kg CO2 |
0 |
0 |
0 |
0 |
LCIA results, resource use, output and waste flows, and carbon emissions & removals per declared unit (1m2) of AIR-SHIELD™ LOW TEMP
Parameter |
Unit |
A1 |
A2 |
A3 |
Total |
LCIA results |
|||||
GWP, IPCCTOTAL |
kg CO2 eq |
1.97E+00 |
1.38E-01 |
2.52E-01 |
2.36E+00 |
GWP, IPCCBIOGENIC |
kg CO2 eq |
-1.80E-02 |
0 |
1.80E-02 |
0 |
GWP, IPCCFOSSIL |
kg CO2 eq |
1.98E+00 |
1.38E-01 |
2.34E-01 |
2.36E+00 |
GWP, TRACI 2.1TOTAL |
kg CO2 eq |
1.92E+00 |
1.37E-01 |
2.60E-01 |
2.32E+00 |
GWP, TRACI 2.1BIOGENIC |
kg CO2 eq |
-1.80E-02 |
0 |
1.80E-02 |
0 |
GWP, TRACI 2.1FOSSIL |
kg CO2 eq |
1.94E+00 |
1.37E-01 |
2.42E-01 |
2.32E+00 |
Ozone depletion |
kg CFC-11 eq |
3.58E-07 |
1.97E-09 |
9.62E-09 |
3.69E-07 |
Acidification |
kg SO2 eq |
7.58E-03 |
3.38E-04 |
1.21E-03 |
9.13E-03 |
Eutrophication |
kg N eq |
1.61E-03 |
2.30E-05 |
4.22E-04 |
2.06E-03 |
Smog |
kg O3 eq |
1.00E-01 |
8.67E-03 |
2.07E-02 |
1.30E-01 |
Respiratory effects |
kg PM2.5 eq |
1.16E-03 |
4.65E-05 |
2.27E-04 |
1.44E-03 |
Additional environmental information |
|||||
Carcinogenics |
CTUh |
77.89% |
0.82% |
21.29% |
100% |
Non-carcinogenics |
CTUh |
51.84% |
7.53% |
40.63% |
100% |
Ecotoxicity |
CTUe |
87.85% |
6.41% |
5.75% |
100% |
Fossil fuel depletion |
MJ surplus |
7.46E+00 |
2.61E-01 |
2.81E-01 |
8.00E+00 |
Resource use indicators |
|||||
Renewable primary energy used as energy carrier (fuel) |
MJ, NCV |
1.02E+01 |
3.01E-03 |
7.44E+00 |
1.76E+01 |
Renewable primary resources with energy content used as material |
MJ, NCV |
5.67E+00 |
0 |
0 |
5.67E+00 |
Total use of renewable primary resources with energy content |
MJ, NCV |
1.58E+01 |
3.01E-03 |
7.44E+00 |
2.33E+01 |
Non-renewable primary resources used as an energy carrier (fuel) |
MJ, NCV |
3.33E+01 |
1.96E+00 |
3.25E+00 |
3.86E+01 |
Non-renewable primary resources with energy content used as material |
MJ, NCV |
2.84E+01 |
0 |
0 |
2.84E+01 |
Total use of non-renewable primary resources with energy content |
MJ, NCV |
6.17E+01 |
1.96E+00 |
3.25E+00 |
6.69E+01 |
Secondary materials |
kg |
0 |
0 |
0 |
0 |
Renewable secondary fuels |
MJ, NCV |
0 |
0 |
0 |
0 |
Non-renewable secondary fuels |
MJ, NCV |
0 |
0 |
0 |
0 |
Recovered energy |
MJ, NCV |
0 |
0 |
0 |
0 |
Use of net fresh water resources |
m3 |
2.67E+00 |
1.14E-02 |
6.15E-01 |
3.30E+00 |
Abiotic depletion (fossil fuels) |
MJ, LHV |
5.68E+01 |
1.84E+00 |
2.76E+00 |
6.14E+01 |
Output flows and waste category indicators |
|||||
Hazardous waste disposed |
kg |
3.85E-02 |
4.29E-04 |
1.30E-02 |
5.19E-02 |
Non-hazardous waste disposed |
kg |
1.80E+00 |
1.70E-03 |
8.30E-02 |
1.88E+00 |
High-level radioactive waste, conditioned, to final repository |
kg |
1.41E-06 |
0 |
5.51E-06 |
6.92E-06 |
Intermediate- and low-level radioactive waste, conditioned, to final repository |
kg |
3.25E-06 |
9.33E-08 |
1.35E-05 |
1.68E-05 |
Components for re-use |
kg |
0 |
0 |
0 |
0 |
Materials for recycling |
kg |
0 |
0 |
0 |
0 |
Materials for energy recovery |
kg |
0 |
0 |
0 |
0 |
Exported energy |
MJ |
0 |
0 |
0 |
0 |
Carbon emissions and removals |
|||||
Biogenic carbon removal from product |
kg CO2 |
0 |
0 |
0 |
0 |
Biogenic carbon emission from product |
kg CO2 |
0 |
0 |
0 |
0 |
Biogenic carbon removal from packaging |
kg CO2 |
-1.80E-02 |
0 |
-6.93E-01 |
-7.11E-01 |
Biogenic carbon emission from packaging |
kg CO2 |
0 |
0 |
1.80E-02 |
1.80E-02 |
Biogenic carbon emission from combustion of waste from renewable sources used in production processes |
kg CO2 |
0 |
0 |
0 |
0 |
Calcination carbon emissions |
kg CO2 |
0 |
0 |
0 |
0 |
Carbonation carbon removals |
kg CO2 |
0 |
0 |
0 |
0 |
Carbon emissions from combustion of waste from non-renewable sources used in production processes |
kg CO2 |
0 |
0 |
0 |
0 |
LCIA results, resource use, output and waste flows, and carbon emissions & removals per declared unit (1m2) of AIR-SHIELD™ XLT
Parameter |
Unit |
A1 |
A2 |
A3 |
Total |
LCIA results |
|||||
GWP, IPCCTOTAL |
kg CO2 eq |
1.73E+00 |
1.13E-01 |
2.14E-01 |
2.05E+00 |
GWP, IPCCBIOGENIC |
kg CO2 eq |
-1.52E-02 |
0 |
1.52E-02 |
0 |
GWP, IPCCFOSSIL |
kg CO2 eq |
1.74E+00 |
1.13E-01 |
1.99E-01 |
2.05E+00 |
GWP, TRACI 2.1TOTAL |
kg CO2 eq |
1.69E+00 |
1.11E-01 |
2.21E-01 |
2.02E+00 |
GWP, TRACI 2.1BIOGENIC |
kg CO2 eq |
-1.52E-02 |
0 |
1.52E-02 |
0 |
GWP, TRACI 2.1FOSSIL |
kg CO2 eq |
1.70E+00 |
1.11E-01 |
2.06E-01 |
2.02E+00 |
Ozone depletion |
kg CFC-11 eq |
3.51E-07 |
1.60E-09 |
8.75E-09 |
3.62E-07 |
Acidification |
kg SO2 eq |
6.56E-03 |
2.75E-04 |
1.02E-03 |
7.85E-03 |
Eutrophication |
kg N eq |
1.40E-03 |
1.87E-05 |
3.54E-04 |
1.77E-03 |
Smog |
kg O3 eq |
8.63E-02 |
7.05E-03 |
1.73E-02 |
1.11E-01 |
Respiratory effects |
kg PM2.5 eq |
1.00E-03 |
3.78E-05 |
1.93E-04 |
1.23E-03 |
Additional environmental information |
|||||
Carcinogenics |
CTUh |
77.14% |
0.79% |
22.07% |
100% |
Non-carcinogenics |
CTUh |
50.56% |
6.99% |
42.45% |
100% |
Ecotoxicity |
CTUe |
88.27% |
5.94% |
5.79% |
100% |
Fossil fuel depletion |
MJ surplus |
6.54E+00 |
2.12E-01 |
2.44E-01 |
6.99E+00 |
Resource use indicators |
|||||
Renewable primary energy used as energy carrier (fuel) |
MJ, NCV |
7.64E+00 |
2.24E-03 |
3.30E+01 |
4.06E+01 |
Renewable primary resources with energy content used as material |
MJ, NCV |
3.42E+00 |
0 |
0 |
3.42E+00 |
Total use of renewable primary resources with energy content |
MJ, NCV |
1.11E+01 |
2.24E-03 |
3.30E+01 |
4.41E+01 |
Non-renewable primary resources used as an energy carrier (fuel) |
MJ, NCV |
2.32E+01 |
1.42E+00 |
1.75E+01 |
4.22E+01 |
Non-renewable primary resources with energy content used as material |
MJ, NCV |
2.08E+01 |
0 |
0 |
2.08E+01 |
Total use of non-renewable primary resources with energy content |
MJ, NCV |
4.41E+01 |
1.42E+00 |
1.75E+01 |
6.30E+01 |
Secondary materials |
kg |
0 |
0 |
0 |
0 |
Renewable secondary fuels |
MJ, NCV |
0 |
0 |
0 |
0 |
Non-renewable secondary fuels |
MJ, NCV |
0 |
0 |
0 |
0 |
Recovered energy |
MJ, NCV |
0 |
0 |
0 |
0 |
Use of net fresh water resources |
m3 |
3.32E+00 |
1.21E-02 |
6.18E-01 |
3.95E+00 |
Abiotic depletion (fossil fuels) |
MJ, LHV |
7.32E-01 |
3.21E-03 |
2.29E-01 |
9.63E-01 |
Output flows and waste category indicators |
|||||
Hazardous waste disposed |
kg |
3.33E-02 |
3.49E-04 |
1.04E-02 |
4.40E-02 |
Non-hazardous waste disposed |
kg |
1.62E+00 |
1.38E-03 |
7.21E-02 |
1.69E+00 |
High-level radioactive waste, conditioned, to final repository |
kg |
1.21E-06 |
0 |
2.88E-06 |
4.10E-06 |
Intermediate- and low-level radioactive waste, conditioned, to final repository |
kg |
2.80E-06 |
7.59E-08 |
7.64E-06 |
1.05E-05 |
Components for re-use |
kg |
0 |
0 |
0 |
0 |
Materials for recycling |
kg |
0 |
0 |
0 |
0 |
Materials for energy recovery |
kg |
0 |
0 |
0 |
0 |
Exported energy |
MJ |
0 |
0 |
0 |
0 |
Carbon emissions and removals |
|||||
Biogenic carbon removal from product |
kg CO2 |
0 |
0 |
0 |
0 |
Biogenic carbon emission from product |
kg CO2 |
0 |
0 |
0 |
0 |
Biogenic carbon removal from packaging |
kg CO2 |
-1.52E-02 |
0 |
-4.18E-01 |
-4.34E-01 |
Biogenic carbon emission from packaging |
kg CO2 |
0 |
0 |
1.52E-02 |
1.52E-02 |
Biogenic carbon emission from combustion of waste from renewable sources used in production processes |
kg CO2 |
0 |
0 |
0 |
0 |
Calcination carbon emissions |
kg CO2 |
0 |
0 |
0 |
0 |
Carbonation carbon removals |
kg CO2 |
0 |
0 |
0 |
0 |
Carbon emissions from combustion of waste from non-renewable sources used in production processes |
kg CO2 |
0 |
0 |
0 |
0 |