LCA results & interpretation Earthwool® 1000° Pipe Insulation ASJ+
Scope and summary
- Cradle to gate
- Cradle to gate with options
- Cradle to grave
The system boundary is cradle-to-installation with end of life.
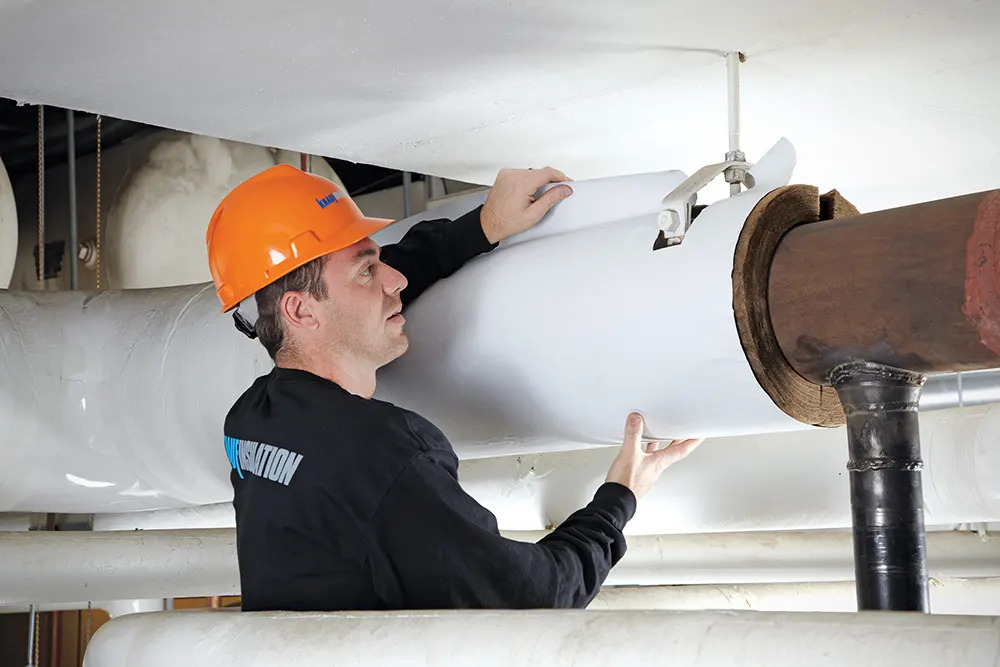
Application
Used to insulate iron, copper, stainless steel, PVC, and CPVC piping in both hot and cold systems. It can be used for both concealed and exposed piping systems, operating at temperatures ranging from 0°F to 1000°F (-18°C to 538°C). For outdoor use, additional weather protection is required.
Declared unit
This study includes Earthwool® 1000° Pipe Insulation available either unfaced or with a factory-applied ASJ+ jacket, and ALLEY-K™ Pipe Insulation available unfaced. The amount of insulation material in the faced and unfaced versions of the product is the same. The amount of self-sealing lap (SSL) is dependent on the length of insulation but not the diameter or thickness. The faced Earthwool® 1000° Pipe Insulation optionally includes a facer material (ASJ+) that is adhered to the surface of the fiberglass insulation during manufacture, and the amount of facer is dependent on diameter, thickness, and length. This facer is then connected to other sections using an added adhesive strip to the seams (butt strip), and the amount of butt strip is dependent on the outer diameter. For this reason, results are presented per several declared units.
Earthwool® 1000° Pipe Insulation and ALLEY-K™ Pipe Insulation: One meter (m) of pipe insulation material weighing 1.00 kg, including packaging, with an expected service life (ESL) of 75 years. At this declared unit, the density is 77.7 kg/m3, the thickness is 4.49 cm, and the outer diameter is 12.57 cm.
ASJ+ facer: One square meter (m2) of facer (0.156 kg).
Self-sealing lap (SSL): One meter (m) of fastening adhesive tape (0.0031 kg).
Butt strip: One meter (m) of sealing butt strip (0.0161 kg).
Manufacturing data
Reporting period: January 2019 – December 2019
Location: Shelbyville, IN
Default packaging, installation, and disposal scenarios
Pipe insulation is packaged into cardboard cartons and distributed to construction sites. Upon arrival, it unpackaged and installed with no additional materials required for installation. After installation, packaging is sent to be landfilled, recycled, or incinerated, while waste insulation is sent to a landfill. Some insulation material is assumed to be lost or wasted due to over-ordering, packaging damage, and other scrap-related reasons. Disposal rates for packaging waste treatment methods are designated as 75% to recycling, 20% to landfill, and 5% to incineration.
Sensitivity analysis
All energy was accounted for, although not all data was able to be assigned to specific manufacturing processes. Since energy is a major contributor to global warming, a sensitivity analysis was conducted by changing the amount of this uncategorized energy by ±100%. The result shows that changing uncategorized energy consumption by 100% changes the emissions in the manufacturing stage by 13%, which in turn changes the overall emissions across all life cycle stages by 11%.

What’s causing the greatest impacts
All life cycle stages
The manufacturing stage dominates the results for most impact categories. Contributing processes include the energy required to melt the glass and produce the glass fibers. Raw material production also constitutes a significant contribution to the impacts across all inventory and impact indicators. Outbound transport accounts for a notable impact only in the global warming and smog formation impact categories. Installation contributes a small fraction of the overall life cycle impact, with the only installation impacts being associated with packaging disposal. At the end of life, insulation is manually removed from the building and landfilled. For all products, waste is dominated by the final disposal of the product. Non-hazardous waste accounts for waste generated during manufacturing and installation. No substances required to be reported as hazardous are associated with the production of this product.
Raw materials acquisition and transportation
The raw material acquisition stage is the second highest contributor for most impact categories, but ozone depletion potential is almost entirely generated from this stage. The raw materials acquisition stage impact is largely due to the borax, manganese oxide, and soda ash in the batch and the sugars in the binder. Third-party verified ISO 14040/44 secondary LCI data sets contribute more than 80% of the total impacts to ozone depletion.
Manufacturing
The manufacturing stage has the most significant contribution to all impact categories, primarily due to the energy required to melt the glass and produce the glass fibers. Except for ozone depletion, the manufacturing stage is the highest contributor to all the impact categories. It accounts for over 50% of the impacts among nine categories.
Distribution
Outbound transportation is the second highest contributor to ecotoxicity impacts.


How we're making it greener
Knauf and Manson are committed to providing products that conserve energy and preserve natural resources.
- This product uses ECOSE® Technology, which is a bio-based binder adhesive instead of a fossil fuel-based binder. ECOSE® Technology represents a fossil fuel avoidance equivalent of 100,000 barrels of oil a year for Knauf products.
- Earthwool® 1000° Pipe Insulation and ALLEY-K™ Pipe Insulation are formaldehyde-free and made from sustainable resources such as recycled glass and sand.
- Our product contains a high degree of recycled content, which translates to 20% less glass melting energy and a 25% reduction in embodied carbon.
- Our utilization of recycled content reduces mining impacts by 60%. In fact, Knauf recycles 10 railcars of recycled glass a day.
- Knauf Insulation's glass is audited by a 3rd party to ensure biosoluble chemistry from a health and safety standpoint.
LCA results
| Life cycle stage | RAW MATERIAL ACQUISITION | MANUFACTURING | Distribution | INSTALLATION AND USE STAGE | Disposal / reuse / recycling |
|
Information modules: *Module D is also excluded from this system boundary (MND). |
(X) A1 Raw materials acquisition | (X) A3 Manufacturing | (X) A4 Distribution | (X) A5 Installation | (X) C1 Deconstruction |
| (X) A2 Transportation | (MND) B1 Use | (X) C2 Transportation | |||
| (MND) B2 Maintenance | (X) C3 Waste processing | ||||
| (MND) B3 Repair | (X) C4 Disposal | ||||
| (MND) B4 Replacement | |||||
| (MND) B5 Refurbishment | |||||
| (MND) B6 Operational energy use | |||||
| (MND) B7 Operational water use | |||||
 |
 |
 |
 |
SM Single Score
Learn about SM Single Score results| Impacts of 1 meter of pipe insulation material (unfaced) | 5.92E-03 mPts | 4.06E-02 mPts | 5.44E-04 mPts | 2.45E-04 mPts | 5.70E-04 mPts |
| Materials or processes contributing >20% to total impacts in each life cycle stage | Batch material and binder material production. | Energy required to melt the glass and produce the glass fibers. | Truck and rail transportation used to transport product to building site. | Transportation to landfill and landfilling of packaging materials. | Transportation to landfill and landfilling of product at end of life. |
TRACI v2.1 results for Earthwool® 1000° Pipe Insulation and ALLEY-K™ Pipe Insulation per declared unit (1m)
| Life cycle stage | RAW MATERIAL ACQUISITION | MANUFACTURING | Distribution | INSTALLATION AND USE STAGE | Disposal / reuse / recycling |
Ecological damage
Human health damage
Additional environmental information
| Impact category | Unit | |||||
| Carcinogenics | CTUh Comparative Toxic Units of Human cancerous toxicity Carcinogens have the potential to form cancers in humans. |
18.0% | 69.6% | 1.1% | 1.5% | 9.8% |
| Non-carcinogenics | CTUh Comparative Toxic Units of Human non-cancerous toxicity Non-Carcinogens have the potential to causes non-cancerous adverse impacts to human health. |
27.7% | 53.2% | 1.3% | 2.1% | 15.6% |
| Fossil fuel depletion | MJ, LHV Mega Joule, lower heating value Fossil fuel depletion is the surplus energy to extract minerals and fossil fuels. |
2.82E-01 | 2.76E+00 | 5.51E-02 | 9.23E-03 | 5.13E-02 |
| Ecotoxicity | CTUe Comparative Toxic Units of Ecotoxicity Ecotoxicity causes negative impacts to ecological receptors and, indirectly, to human receptors through the impacts to the ecosystem. |
27.2% | 66.2% | 3.5% | 0.5% | 2.6% |
TRACI v2.1 results for ASJ+ facer per declared unit (1m2)
| Life cycle stage | RAW MATERIAL ACQUISITION | MANUFACTURING | Distribution | INSTALLATION AND USE STAGE | Disposal / reuse / recycling |
Ecological damage
Human health damage
Additional environmental information
| Impact category | Unit | |||||
| Carcinogenics | CTUh Comparative Toxic Units of Human cancerous toxicity Carcinogens have the potential to form cancers in humans. |
94.8% | 0% | 0.4% | 0% | 4.8% |
| Non-carcinogenics | CTUh Comparative Toxic Units of Human non-cancerous toxicity Non-Carcinogens have the potential to causes non-cancerous adverse impacts to human health. |
91.7% | 0% | 0.3% | 0% | 8.0% |
| Fossil fuel depletion | MJ, LHV Mega Joule, lower heating value Fossil fuel depletion is the surplus energy to extract minerals and fossil fuels. |
8.90E-01 | 0.00E+00 | 8.59E-03 | 0.00E+00 | 1.01E-02 |
| Ecotoxicity | CTUe Comparative Toxic Units of Ecotoxicity Ecotoxicity causes negative impacts to ecological receptors and, indirectly, to human receptors through the impacts to the ecosystem. |
96.4% | 0% | 0.7% | 0% | 2.9% |
TRACI v2.1 results for self-sealing lap (SSL) per declared unit (1m)
| Life cycle stage | RAW MATERIAL ACQUISITION | MANUFACTURING | Distribution | INSTALLATION AND USE STAGE | Disposal / reuse / recycling |
Ecological damage
Human health damage
Additional environmental information
| Impact category | Unit | |||||
| Carcinogenics | CTUh Comparative Toxic Units of Human cancerous toxicity Carcinogens have the potential to form cancers in humans. |
98.2% | 0% | 0.1% | 0% | 1.7% |
| Non-carcinogenics | CTUh Comparative Toxic Units of Human non-cancerous toxicity Non-Carcinogens have the potential to causes non-cancerous adverse impacts to human health. |
97.3% | 0% | 0.1% | 0% | 2.6% |
| Fossil fuel depletion | MJ, LHV Mega Joule, lower heating value Fossil fuel depletion is the surplus energy to extract minerals and fossil fuels. |
3.72E-02 | 0.00E+00 | 1.70E-04 | 0.00E+00 | 1.99E-04 |
| Ecotoxicity | CTUe Comparative Toxic Units of Ecotoxicity Ecotoxicity causes negative impacts to ecological receptors and, indirectly, to human receptors through the impacts to the ecosystem. |
96.2% | 0% | 0.7% | 0% | 3.0% |
TRACI v2.1 results for butt strip per declared unit (1m)
| Life cycle stage | RAW MATERIAL ACQUISITION | MANUFACTURING | Distribution | INSTALLATION AND USE STAGE | Disposal / reuse / recycling |
Ecological damage
Human health damage
Additional environmental information
| Impact category | Unit | |||||
| Carcinogenics | CTUh Comparative Toxic Units of Human cancerous toxicity Carcinogens have the potential to form cancers in humans. |
93.2% | 0% | 1.3% | 0% | 5.5% |
| Non-carcinogenics | CTUh Comparative Toxic Units of Human non-cancerous toxicity Non-Carcinogens have the potential to causes non-cancerous adverse impacts to human health. |
95.3% | 0% | 0.2% | 0% | 4.5% |
| Fossil fuel depletion | MJ, LHV Mega Joule, lower heating value Fossil fuel depletion is the surplus energy to extract minerals and fossil fuels. |
1.19E-01 | 0.00E+00 | 8.88E-04 | 0.00E+00 | 1.04E-03 |
| Ecotoxicity | CTUe Comparative Toxic Units of Ecotoxicity Ecotoxicity causes negative impacts to ecological receptors and, indirectly, to human receptors through the impacts to the ecosystem. |
93.2% | 0% | 1.3% | 0% | 5.5% |
References
LCA Background Report
Knauf Earthwool® 1000° Pipe Insulation and Manson ALLEY-K™ Pipe Insulation LCA Background Report (public version), Knauf 2023; developed using the TRACI v2.1 impact assessment methodology and LCA for Experts modeling software.
ISO 14025, “Sustainability in buildings and civil engineering works -- Core rules for environmental product declarations of construction products and services”
ISO 21930:2017 serves as the core PCR along with UL Part A.
ULE Part A: Life Cycle Assessment Calculation Rules and Report Requirements v4.0
March, 2022. PCR review conducted by Lindita Bushi, Chair (Athena Sustainable Materials Institute), Hugues Imbeault-Tétreault, Chair (Group AGECO), and Jack Geibig (Ecoform).
ULE Part B for Mechanical, Specialty, Thermal, and Acoustic Insulation Product EPD Requirements
September, 2019. PCR review conducted by Hugues Imbeault-Tétreault, Chair (Group AGECO), Thomas Gloria (Industrial Ecology Consultants), and Andre Omer Desjarlais (Oak Ridge National Laboratory).
UL Environment General Program Instructions v2.4, July 2018 (available upon request)

Download PDF SM Transparency Report, which includes the additional EPD content required by the UL Environment PCR.
SM Transparency Reports (TR) are ISO 14025 Type III environmental declarations (EPD) that enable purchasers and users to compare the potential environmental performance of products on a life cycle basis. Environmental declarations from different programs (ISO 14025) may not be comparable. Comparison of the environmental performance of products using EPD information shall be based on the product’s use and impacts at the building level, and therefore EPDs may not be used for comparability purposes when not considering the building energy use phase as instructed under this PCR. Full conformance with the PCR for Mechanical Thermal Insulation allows EPD comparability only when all stages of a life cycle have been considered. However, variations and deviations are possible. Example of variations: Different LCA software and background LCI datasets may lead to differences results for upstream or downstream of the life cycle stages declared.