EPD additional content PROFLO® Calhoun 1500 Series Toilet
Data
Background This product-average plant-specific declaration was created by collecting production data from the China facility. The toilet with 1.28gpf tank is represented by a production-weighted average of three bowl SKUs (PF1500WH, PF1501WH, and PF1503WH), five tank SKUs (PF6110WH, PF6112RWH, PF6112WH, PF6112WHM, and PF6114WH), and two toilet seat SKUs (PFTSE2000WH and PFTSWSC2000WH). The 1.6gpf tanks is represented by a production-weighted average of three bowl SKUs (PF1500WH, PF1501WH, and PF1503WH), one tank SKU (PF6112KWH), and two toilet seat SKUs (PFTSE2000WH and PFTSWSC2000WH). Together, they represent the possible combinations of a PROFLO® Calhoun 1500 series two-piece toilet.
All unit processes were modeled using primary data from Ferguson’s outsourced manufacturing facilities in combination with their internal operations data. Secondary data sources include ecoinvent and USLCI databases. Literature data was used to fill any data gaps to complete the inventory.
Allocation of multi-input and multi-output processes follows a mass-based approach in the collected data, which is the most appropriate for the unit processes modeled. Allocation approaches in the background data follow the ecoinvent methodology. No co-product allocations were made in the model.
Cut-off criteria for the inclusion of mass and energy flows are 1% of renewable primary resource (energy) usage, 1% nonrenewable primary resource (energy) usage, 1% of the total mass input of that unit process, and 1% of environmental impacts. The total of neglected input flows per module does not exceed 5% of energy usage, mass, and environmental impacts. The only exceptions to these criteria are substances with hazardous and toxic properties, which must be listed even when the given process unit is under the cut-off criterion of 1% of the total mass. No known flows are deliberately excluded from this declaration, and no substances considered to be hazardous or toxic according to the TRI or local regulations are present in the products. Therefore, these criteria have been met. Biogenic carbon is included in reported results.
Major system boundary exclusions
- Construction of major capital equipment
- Maintenance and operation of support equipment
- Human labor and employee transport
- Manufacture and transport of packaging not associated with final product
- Disposal of packaging materials not associated with the final product
- Building operational energy and water use
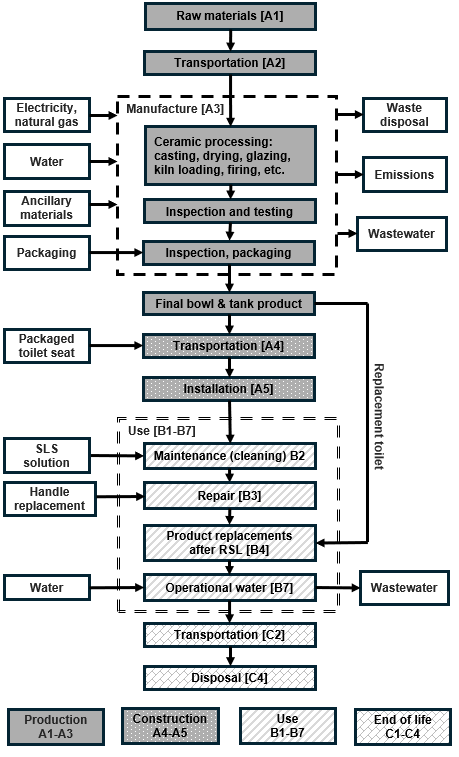
Flow diagram
Scenarios and additional technical information
Distribution [A4]
Toilet bowls and tanks manufactured in China are first shipped to Ferguson’s distribution centers in the United States via several US ports.
Distribution method |
Distance |
| Total road transport (average) | 651 km |
| Sea transport to US ports (average) | 14,835 km |
The final transportation distance from Ferguson distribution centers to the final installation site differs for each product type.
| Product type | Distance (average) |
| Toilet bowl | 312 km |
| Toilet tank 1.6 gpf | 853 km |
| Toilet tank 1.28 gpf | 407 km |
| Toilet seat | 606 km |
Installation [A5]
Installation of toilets is manual, and the resulting packaging waste is assumed to be transported 100 km to final disposal. Disposal scenarios for packaging are assumed to be 80.88% recycled, 15.37% landfilled, and the remaining incinerated, in alignment with US EPA’s 2018 end of life data for containers and packaging.
End-of-life [C1-C4]
The model reflects the assumptions that toilets are 100% landfilled. The product is assumed to be transported 100 km via truck to final disposal.
Product information
| Product type | Product specification | Description |
| Two-piece toilet 1.28gpf | IAPMO/cUPC ASME A112.19.2 / CAS B45.1 MaP Rated 1000g |
1.28 GPF 15-1/2'' or 17" round front or elongated toilet with 10", 12'', or 14" rough-in tank (ADA options available) |
| Two-piece toilet 1.6gpf | 1.6 GPF 15-1/2'' round front or 17" elongated toilet with 12'' rough-in tank |
Major assumptions and limitations
- Since energy and resource inputs were not available on a per-product basis for toilet tanks and bowls, electricity and other resources consumed were allocated to the SKUs studied by mass. Later, resources per kilogram of ceramic processed were developed. Slight deviations between SKUs are possible.
- Toilet seats may be sourced from any manufacturer, including Ferguson. Ferguson also has several seat SKUs; however, an average of the heaviest and lightest seats (by mass) was used. While the potential environmental impact from the seat is insignificant to the overall results, some seat types will have higher impacts than others.
- Water consumption plays a significant role in the total potential environmental impacts of toilets. While water use assumptions were defined by the PCR, changes to the number of uses per day are expected to significantly impact the total results.
- Generic data sets used for material inputs, transportation, and waste processing are considered good quality, but actual impacts from material suppliers, transport carriers, and local waste processing may vary.
Data quality assessment
Precision: As the relevant foreground data is primary data or modeled based on primary information from the owner of the technology, precision is considered to be high. Background data is from the ecoinvent v3.10 and US-EI 2.2 databases with documented precision to the extent available.
Completeness: The product system was checked for mass balance and completeness of the inventory. The data included is considered complete based on our understanding of the manufacturing site and a review with key stakeholders on the Ferguson team, and cut-off criteria were observed consistent with those prescribed in the PCR. Besides capital equipment, no data was knowingly omitted.
Consistency: The consistency of the model is considered high. Primary data were collected with a similar level of detail, while background data were sourced primarily from the ecoinvent database. Other databases were used if data were not available in ecoinvent or the data set was judged to be more representative.
PROFLO® Calhoun 1500 Series Two-piece Toilet 1.28 gpf - Resource use, output and waste flows, and carbon emissions & removals per functional unit
| Parameters | Unit | A1-A3 | A4-A5 | B1 | B2 | B3 | B4 | B5 | B6 | B7 | C1-C4 | Total |
| Resource use indicators | ||||||||||||
| Renewable primary energy used as energy carrier (RPRE) | MJ, NCV | 4.18E+01 | 2.61E-01 | 0 | 7.67E+01 | 1.44E+00 | 1.16E+02 | 0 | 0 | 1.59E+03 | 1.61E-01 | 1.83E+03 |
| Renewable primary resources with energy content used as material (RPRM) | MJ, NCV | 2.43E+01 | 0 | 0 | 0 | 0 | 5.82E+01 | 0 | 0 | 0 | 0 | 9.11E+01 |
| Total use of renewable primary resources with energy content (RPRtotal) | MJ, NCV | 6.61E+01 | 2.61E-01 | 0 | 7.67E+01 | 1.44E+00 | 1.16E+02 | 0 | 0 | 1.59E+03 | 1.61E-01 | 1.92E+03 |
| Non-renewable primary resources used as an energy carrier (NRPRE) | MJ, NCV | 7.60E+02 | 1.36E+02 | 0 | 1.63E+01 | 0 | 4.47E+01 | 0 | 0 | 1.78E+04 | 6.87E+01 | 2.15E+04 |
| Non-renewable primary resources with energy content used as material (NRPRM) | MJ, NCV | 9.41E+01 | 0 | 0 | 0 | 0 | 0 | 0 | 0 | 0 | 0 | 3.53E+02 |
| Total use of non-renewable primary resources with energy content (NRPRtotal) | MJ, NCV | 8.54E+02 | 1.36E+02 | 0 | 1.63E+01 | 0 | 4.47E+01 | 0 | 0 | 1.78E+04 | 6.87E+01 | 2.18E+04 |
| Secondary materials (SM) | kg | 0 | 0 | 0 | 0 | 0 | 0 | 0 | 0 | 0 | 0 | 0 |
| Renewable secondary fuels (RSF) | MJ, NCV | 0 | 0 | 0 | 0 | 0 | 0 | 0 | 0 | 0 | 0 | 0 |
| Non-renewable secondary fuels (NRSF) | MJ, NCV | 0 | 0 | 0 | 0 | 0 | 0 | 0 | 0 | 0 | 0 | 0 |
| Recovered energy (RE) | MJ, NCV | 0 | 0 | 0 | 0 | 0 | 0 | 0 | 0 | 0 | 0 | 0 |
| Use of net fresh water resources (FW) | m3 | 8.58E+01 | 1.00E+00 | 0 | 5.31E+00 | 6.05E+00 | 2.39E+02 | 0 | 0 | 5.36E+02 | 3.08E-01 | 8.74E+02 |
| Output flows and waste category indicators | ||||||||||||
| Hazardous waste disposed (HWD) | kg | 2.10E-02 | 0 | 0 | 0 | 0 | 5.78E-02 | 0 | 0 | 0 | 0 | 7.56E-02 |
| Non-hazardous waste disposed (NHWD) | kg | 0 | 2.98E-01 | 0 | 0 | 0 | 1.12E+02 | 0 | 0 | 0 | 4.03E+01 | 1.47E+02 |
| High-level radioactive waste, conditioned, to final repository (HLRW) | kg | 8.58E-03 | 1.12E-04 | 0 | 1.62E-04 | 4.34E-04 | 2.39E-02 | 0 | 1.80E+00 | 2.80E-01 | 1.42E-05 | 2.56E-01 |
| Intermediate- and low-level radioactive waste, conditioned, to final repository (ILLRW) | kg | 1.43E-03 | 6.09E-05 | 0 | 1.53E-07 | 2.76E-04 | 4.17E-03 | 0 | 5.98E+00 | 9.39E-01 | 3.04E-05 | 7.57E-01 |
| Components for re-use (CRU) | kg | 0 | 0 | 0 | 0 | 0 | 0 | 0 | 0 | 0 | 0 | 0 |
| Materials for recycling (MR) | kg | 5.13E+00 | 4.73E+00 | 0 | 4.74E+00 | 0 | 1.83E+01 | 0 | 0 | 0 | 0 | 2.41E+01 |
| Materials for energy recovery (MER) | kg | 5.29E-02 | 0 | 0 | 0 | 0 | 1.45E-01 | 0 | 0 | 0 | 0 | 1.90E-01 |
| Exported energy (EE) | MJ | 9.72E-01 | 0 | 0 | 0 | 0 | 2.67E+00 | 0 | 0 | 0 | 0 | 3.50E+00 |
| Carbon emissions and removals | ||||||||||||
| Biogenic Carbon Removal from Product (BCRP) | kg CO2 | 0 | 0 | 0 | 0 | 0 | 0 | 0 | 0 | 0 | 0 | 0 |
| Biogenic Carbon Emission from Product (BCEP) | kg CO2 | 0 | 0 | 0 | 0 | 0 | 0 | 0 | 0 | 0 | 0 | 0 |
| Biogenic Carbon Removal from Packaging (BCRK) | kg CO2 | 3.46E+00 | 0 | 0 | 0 | 0 | 9.52E+00 | 0 | 0 | 0 | 0 | 1.30E+01 |
| Biogenic Carbon Emission from Packaging (BCEK) | kg CO2 | 0 | 2.89E+00 | 0 | 0 | 0 | 7.99E+00 | 0 | 0 | 0 | 1.18E-02 | 1.09E+01 |
| Biogenic Carbon Emission from Combustion of Waste from Renewable Sources Used in Production Processes (BCEW) | kg CO2 | 0 | 1.28E-01 | 0 | 0 | 0 | 3.52E-01 | 0 | 0 | 0 | 0 | 4.80E-01 |
| Calcination Carbon Emissions (CCE) | kg CO2 | 0 | 0 | 0 | 0 | 0 | 0 | 0 | 0 | 0 | 0 | 0 |
| Carbonation Carbon Removals (CCR) | kg CO2 | 0 | 0 | 0 | 0 | 0 | 0 | 0 | 0 | 0 | 0 | 0 |
| Carbon Emissions from Combustion of Waste from Non-Renewable Sources used in Production Processes (CWNR) | kg CO2 | 0 | 0 | 0 | 0 | 0 | 0 | 0 | 0 | 0 | 0 | 0 |
PROFLO® Calhoun 1500 Series Two-piece Toilet 1.6 gpf - Resource use, output and waste flows, and carbon emissions & removals per functional unit
| Parameters | Unit | A1-A3 | A4-A5 | B1 | B2 | B3 | B4 | B5 | B6 | B7 | C1-C4 | Total |
| Resource use indicators | ||||||||||||
| Renewable primary energy used as energy carrier (RPRE) | MJ, NCV | 4.26E+01 | 3.99E-02 | 0 | 7.67E+01 | 1.58E+00 | 1.18E+02 | 0 | 0 | 1.99E+03 | 1.68E-01 | 2.23E+03 |
| Renewable primary resources with energy content used as material (RPRM) | MJ, NCV | 2.43E+01 | 0 | 0 | 0 | 0 | 6.69E+01 | 0 | 0 | 0 | 0 | 9.13E+01 |
| Total use of renewable primary resources with energy content (RPRtotal) | MJ, NCV | 6.69E+01 | 3.99E-02 | 0 | 7.67E+01 | 1.58E+00 | 1.85E+02 | 0 | 0 | 1.99E+03 | 1.68E-01 | 2.32E+03 |
| Non-renewable primary resources used as an energy carrier (NRPRE) | MJ, NCV | 7.82E+02 | 1.61E+02 | 0 | 1.63E+01 | 4.82E+01 | 2.79E+03 | 0 | 0 | 2.22E+04 | 7.14E+01 | 2.61E+04 |
| Non-renewable primary resources with energy content used as material (NRPRM) | MJ, NCV | 9.44E+01 | 0 | 0 | 0 | 0 | 2.60E+02 | 0 | 0 | 0 | 0 | 3.54E+02 |
| Total use of non-renewable primary resources with energy content (NRPRtotal) | MJ, NCV | 8.76E+02 | 1.61E+02 | 0 | 1.63E+01 | 4.82E+01 | 3.05E+03 | 0 | 0 | 2.22E+04 | 7.14E+01 | 2.64E+04 |
| Secondary materials (SM) | kg | 0 | 0 | 0 | 0 | 0 | 0 | 0 | 0 | 0 | 0 | 0 |
| Renewable secondary fuels (RSF) | MJ, NCV | 0 | 0 | 0 | 0 | 0 | 0 | 0 | 0 | 0 | 0 | 0 |
| Non-renewable secondary fuels (NRSF) | MJ, NCV | 0 | 0 | 0 | 0 | 0 | 0 | 0 | 0 | 0 | 0 | 0 |
| Recovered energy (RE) | MJ, NCV | 0 | 0 | 0 | 0 | 0 | 0 | 0 | 0 | 0 | 0 | 0 |
| Use of net fresh water resources (FW) | m3 | 8.70E+01 | 1.03E+00 | 0 | 5.31E+00 | 0 | 2.43E+02 | 0 | 0 | 6.70E+02 | 3.08E-01 | 1.01E+03 |
| Output flows and waste category indicators | ||||||||||||
| Hazardous waste disposed (HWD) | kg | 2.10E-02 | 0 | 0 | 0 | 0 | 5.78E-02 | 0 | 0 | 0 | 0 | 7.88E-02 |
| Non-hazardous waste disposed (NHWD) | kg | 0 | 2.98E-01 | 0 | 0 | 0 | 1.12E+02 | 0 | 0 | 0 | 4.03E+01 | 1.52E+02 |
| High-level radioactive waste, conditioned, to final repository (HLRW) | kg | 8.58E-03 | 1.12E-04 | 0 | 1.62E-04 | 4.34E-04 | 2.39E-02 | 0 | 0 | 2.80E-01 | 1.42E-05 | 3.13E-01 |
| Intermediate- and low-level radioactive waste, conditioned, to final repository (ILLRW) | kg | 1.43E-03 | 6.09E-05 | 0 | 1.53E-07 | 2.76E-04 | 4.17E-03 | 0 | 0 | 9.39E-01 | 3.04E-05 | 9.45E-01 |
| Components for re-use (CRU) | kg | 0 | 0 | 0 | 0 | 0 | 0 | 0 | 0 | 0 | 0 | 0 |
| Materials for recycling (MR) | kg | 5.13E+00 | 1.51E+00 | 0 | 0 | 0 | 1.83E+01 | 0 | 0 | 0 | 0 | 2.49E+01 |
| Materials for energy recovery (MER) | kg | 5.29E-02 | 0 | 0 | 0 | 0 | 1.45E-01 | 0 | 0 | 0 | 0 | 1.98E-01 |
| Exported energy (EE) | MJ | 9.72E-01 | 0 | 0 | 0 | 0 | 2.67E+00 | 0 | 0 | 0 | 0 | 3.64E+00 |
| Carbon emissions and removals | ||||||||||||
| Biogenic Carbon Removal from Product (BCRP) | kg CO2 | 0 | 0 | 0 | 0 | 0 | 0 | 0 | 0 | 0 | 0 | 0 |
| Biogenic Carbon Emission from Product (BCEP) | kg CO2 | 0 | 0 | 0 | 0 | 0 | 0 | 0 | 0 | 0 | 0 | 0 |
| Biogenic Carbon Removal from Packaging (BCRK) | kg CO2 | 3.47E+00 | 0 | 0 | 0 | 0 | 9.53E+00 | 0 | 0 | 0 | 0 | 1.30E+01 |
| Biogenic Carbon Emission from Packaging (BCEK) | kg CO2 | 0 | 2.90E+00 | 0 | 0 | 0 | 8.00E+00 | 0 | 0 | 0 | 1.19E-02 | 1.09E+01 |
| Biogenic Carbon Emission from Combustion of Waste from Renewable Sources Used in Production Processes (CBCEW) | kg CO2 | 0 | 1.28E-01 | 0 | 0 | 0 | 3.53E-01 | 0 | 0 | 0 | 0 | 4.80E-01 |
| Calcination Carbon Emissions (CCE) | kg CO2 | 0 | 0 | 0 | 0 | 0 | 0 | 0 | 0 | 0 | 0 | 0 |
| Carbonation Carbon Removals (CCR) | kg CO2 | 0 | 0 | 0 | 0 | 0 | 0 | 0 | 0 | 0 | 0 | 0 |
| Carbon Emissions from Combustion of Waste from Non-Renewable Sources used in Production Processes (CWNR) | kg CO2 | 0 | 0 | 0 | 0 | 0 | 0 | 0 | 0 | 0 | 0 | 0 |
PROFLO® Calhoun 1500 Series Two-piece Toilet 1.28 gpf - LCIA results per functional unit
| Impact category | Unit | A1-A3 | A4 | A5 | B1 | B2 | B3 | B4 | B5 | B6 | B7 | C1 | C2 | C3 | C4 | Total |
| Ozone depletion | kg CFC-11 eq | 1.03E-06 | 5.52E-07 | 4.79E-08 | 0 | 3.70E-08 | 3.31E-08 | 7.27E-06 | 0 | 0 | 4.89E-05 | 0 | 9.80E-07 | 0 | 2.96E-08 | 5.89E-05 |
| Global warming | kg CO2 eq | 6.32E+01 | 1.04E+01 | 6.81E-01 | 0 | 2.18E+00 | 2.35E+00 | 2.19E+02 | 0 | 0 | 1.03E+03 | 0 | 4.88E+00 | 0 | 5.91E-01 | 1.33E+03 |
| Smog | kg O3 eq | 3.93E+00 | 3.38E+00 | 4.01E-02 | 0 | 1.44E-01 | 1.10E-01 | 2.25E+01 | 0 | 0 | 4.19E+01 | 0 | 7.93E-01 | 0 | 5.04E-02 | 7.29E+01 |
| Acidifi-cation | kg SO2 eq | 2.57E-01 | 1.72E-01 | 1.42E-03 | 0 | 2.27E-02 | 7.93E-03 | 1.26E+00 | 0 | 0 | 4.89E+00 | 0 | 2.69E-02 | 0 | 1.78E-03 | 6.64E+00 |
| Eutrophi-cation | kg N eq | 2.40E-02 | 7.13E-03 | 8.02E-04 | 0 | 3.08E-02 | 7.29E-04 | 9.72E-02 | 0 | 0 | 1.36E+01 | 0 | 2.76E-03 | 0 | 6.36E-04 | 1.37E+01 |
| Carcino-genics | CTUh | 2.59E-07 | 3.35E-08 | 5.11E-10 | 0 | 6.23E-08 | 1.15E-08 | 8.12E-07 | 0 | 0 | 3.67E-05 | 0 | 1.40E-09 | 0 | 7.49E-10 | 3.79E-05 |
| Non-carcino-genics | CTUh | 5.84E-06 | 5.00E-07 | 1.47E-08 | 0 | 3.07E-06 | 7.45E-08 | 1.81E-05 | 0 | 0 | 7.43E-04 | 0 | 2.33E-07 | 0 | 5.24E-09 | 7.70E-04 |
| Respiratory effects | kg PM2.5 eq | 4.19E-02 | 9.53E-03 | 1.60E-04 | 0 | 3.46E-03 | 1.17E-03 | 1.51E-01 | 0 | 0 | 2.71E-01 | 0 | 3.14E-03 | 0 | 2.22E-04 | 4.82E-01 |
| Additional environmental information | ||||||||||||||||
| Ecotoxicity | CTUe | 5.94E+01 | 7.67E+00 | 4.87E-02 | 0 | 8.22E+01 | 1.18E+00 | 1.87E+02 | 0 | 0 | 1.75E+03 | 0 | 6.28E-01 | 0 | 3.69E-01 | 2.09E+03 |
| Fossil fuel depletion | MJ surplus | 8.27E+01 | 1.89E+01 | 4.65E-01 | 0 | 1.22E+00 | 5.33E+00 | 3.08E+02 | 0 | 0 | 1.27E+03 | 0 | 9.41E+00 | 0 | 3.73E-01 | 1.70E+03 |
PROFLO® Calhoun 1500 Series Two-piece Toilet 1.6 gpf - LCIA results per functional unit
| Impact category | Unit | A1-A3 | A4 | A5 | B1 | B2 | B3 | B4 | B5 | B6 | B7 | C1 | C2 | C3 | C4 | Total |
| Ozone depletion | kg CFC-11 eq | 1.06E-06 | 8.68E-07 | 4.80E-08 | 0 | 3.70E-08 | 3.65E-08 | 8.31E-06 | 0 | 0 | 6.12E-05 | 0 | 1.02E-06 | 0 | 3.07E-08 | 7.26E-05 |
| Global warming | kg CO2 eq | 6.51E+01 | 1.23E+01 | 6.82E-01 | 0 | 2.18E+00 | 2.52E+00 | 2.30E+02 | 0 | 0 | 1.29E+03 | 0 | 5.07E+00 | 0 | 6.03E-01 | 1.61E+03 |
| Smog | kg O3 eq | 4.06E+00 | 3.63E+00 | 4.01E-02 | 0 | 1.44E-01 | 1.18E-01 | 2.37E+01 | 0 | 0 | 5.23E+01 | 0 | 8.24E-01 | 0 | 5.23E-02 | 8.48E+01 |
| Acidifi-cation | kg SO2 eq | 2.65E-01 | 1.83E-01 | 1.42E-03 | 0 | 2.27E-02 | 8.56E-03 | 1.32E+00 | 0 | 0 | 6.11E+00 | 0 | 2.80E-02 | 0 | 1.85E-03 | 7.94E+00 |
| Eutrophi-cation | kg N eq | 2.45E-02 | 8.01E-03 | 8.03E-04 | 0 | 3.08E-02 | 7.87E-04 | 1.01E-01 | 0 | 0 | 1.69E+01 | 0 | 2.87E-03 | 0 | 6.55E-04 | 1.71E+01 |
| Carcino-genics | CTUh | 2.64E-07 | 3.54E-08 | 5.11E-10 | 0 | 6.23E-08 | 1.23E-08 | 8.30E-07 | 0 | 0 | 4.59E-05 | 0 | 1.45E-09 | 0 | 7.72E-10 | 4.71E-05 |
| Non-carcino-genics | CTUh | 5.98E-06 | 5.73E-07 | 1.48E-08 | 0 | 3.07E-06 | 8.15E-08 | 1.87E-05 | 0 | 0 | 9.28E-04 | 0 | 2.42E-07 | 0 | 5.38E-09 | 9.57E-04 |
| Respiratory effects | kg PM2.5 eq | 4.32E-02 | 1.02E-02 | 1.60E-04 | 0 | 3.46E-03 | 1.27E-03 | 1.57E-01 | 0 | 0 | 3.39E-01 | 0 | 3.27E-03 | 0 | 2.30E-04 | 5.58E-01 |
| Additional environmental information | ||||||||||||||||
| Ecotoxicity | CTUe | 6.12E+01 | 8.55E+00 | 4.87E-02 | 0 | 8.22E+01 | 1.27E+00 | 1.95E+02 | 0 | 0 | 2.18E+03 | 0 | 6.52E-01 | 0 | 3.71E-01 | 2.53E+03 |
| Fossil fuel depletion | MJ surplus | 8.46E+01 | 2.24E+01 | 4.66E-01 | 0 | 1.22E+00 | 5.74E+00 | 3.24E+02 | 0 | 0 | 1.59E+03 | 0 | 9.78E+00 | 0 | 3.88E-01 | 2.04E+03 |