EPD additional content MFI® System
Data
Background This product-specific plant-specific declaration was created by collecting production data from the KWS facility in Deer Park, WA. Secondary data sources include those available in ecoinvent v3.10, Industry data 2.0, and US-EI 2.2 databases.
Allocation The PCR prescribes where and how allocation occurs. Since only facility-level data were available, inputs and outputs were allocated across the five cladding support system types produced at the site. Resource consumption, including electricity and ancillary materials, was assigned based on each system’s share of total annual linear foot production. For the MFI® system, which includes two distinct components—rails and brackets—a second allocation step was applied. The electricity allocated to the MFI® system was further divided between the rails and brackets based on their respective annual in-house production mass. This approach ensured that energy use reflected differences in component weight and production volume.
This two-step allocation approach ensures an equitable and representative distribution of manufacturing resource consumption across all products and subcomponents. Additionally, no recycled materials are used in the product system, and there were no co-products manufactured.
Cut-off criteria for including mass and energy flows are set at 1% of renewable primary energy use, 1% of nonrenewable primary energy use, 1% of the total mass input for a unit process, and 1% of environmental impacts. The total of excluded input flows per module shall not exceed 5% for energy, mass, or environmental impacts. An exception is made for substances with hazardous or toxic properties, which must be reported even if they fall below the 1% mass threshold. No known mass or energy flows have been deliberately excluded from this declaration, confirming that the criteria have been met. Biogenic carbon is included in the reported results.
Quality
Inventory data quality is judged by its precision (measured, calculated, or estimated), completeness (e.g., unreported emissions), consistency (degree of uniformity of the methodology applied on a study serving as a data source), and representativeness (geographical, temporal, and technological).
To cover these requirements and to ensure reliable results, first-hand industry data in combination with consistent background LCA information from SimaPro Developer 9.6, and Ecoinvent v3.10, Industry data 2.0, and US-EI 2.2 databases were used.
Sustainable Minds worked with Knight Wall Systems to obtain a comprehensive set of primary data associated with the manufacturing processes. The product system was checked for mass balance and completeness of the inventory. The data set was considered complete based on our understanding of the manufacturing site and a review with key stakeholders on the KWS team, and cut-off criteria were observed consistent with those prescribed in the PCR. Capital equipment was excluded as required by the PCR. Otherwise, no data was knowingly omitted. Where country-specific data were unavailable, global or rest-of-world averages were used as proxies to represent transportation in those locations. Additionally, no proxy data were used to represent materials and therefore did not have a significant impact of the results.
Primary data were collected with a similar level of detail, while background data were sourced primarily from the ecoinvent database, and other databases were used if data were not available in ecoinvent or the data set was judged to be more representative. Other methodological choices were made consistently throughout the model.
Major system boundary exclusions:
- Construction of major capital equipment
- Manufacturing, maintenance, and operation of support equipment
- Human labor and employee transport
- Manufacture and transport of packaging materials not associated with the final product
- Disposal of packaging materials not associated with the final product
- Building operational energy and water use
Technical information
Major assumptions and limitations:
- The products evaluated in this report may optionally be coated with a black PVDF coating, which was excluded from this analysis.
- Primary data were modeled based on information provided by KWS for calendar year 2024. However, upstream supply chain data are subject to variability, which may impact the accuracy of the results.
- Upstream suppliers were contacted to gather information on component processing, including manufacturing activities, waste handling, and scrap rates. However, the data provided are based on estimates rather than primary data collected directly from the upstream facilities.
- Due to the unavailability of separate electricity data for each system type, electricity consumption in the manufacturing facility was allocated proportionately based on the linear foot production of each system type. However, slight deviations may exist between system types, which could affect the accuracy of the allocation.
- Generic data sets used for material inputs, transport, and waste processing are considered good quality, but actual impacts from material suppliers, transport carriers, and local waste processing may vary.
- The impact assessment methodology categories do not represent all possible environmental impact categories.
- Characterization factors used within the impact assessment methodology may contain varying levels of uncertainty.
- LCA results are relative expressions and do not predict impacts on category endpoints, the exceeding of thresholds, safety margins, or risks.
- No "green power" is used in this declaration.
- No renewable certificates or purchased CO2 offsets are included.
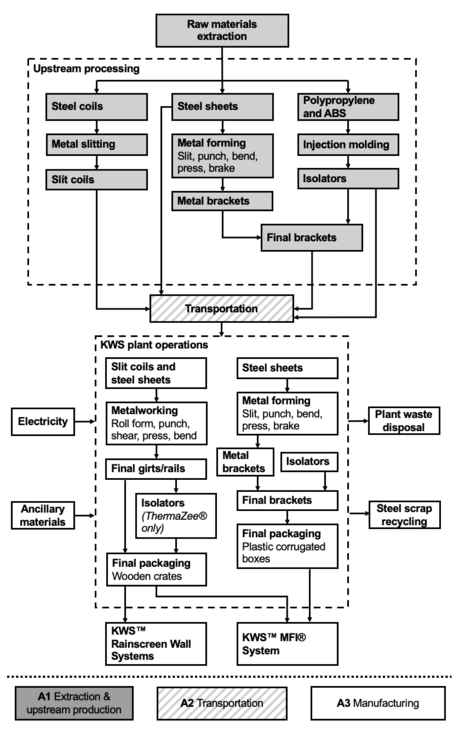
Flow diagram
MFI® system: LCIA results, resource use, output and waste flows, and carbon emissions & removals per declared unit
| Parameter | Unit | [A1] Extraction & upstream processing | [A2] Transport | [A3] Manufacturing | Cradle-to-gate total |
| Life cycle impact assessment results | |||||
| Ozone depletion | kg CFC-11 eq | 2.09E-08 | 3.02E-09 | 6.30E-09 | 3.03E-08 |
| Global warming | kg CO2 eq | 3.71E+00 | 2.06E-01 | 8.26E-02 | 4.00E+00 |
| Smog | kg O3 eq | 1.33E-01 | 5.01E-02 | 6.66E-03 | 1.90E-01 |
| Acidification | kg SO2 eq | 9.88E-03 | 1.55E-03 | 4.14E-04 | 1.18E-02 |
| Eutrophication | kg N eq | 1.40E-03 | 9.85E-05 | 4.71E-05 | 1.54E-03 |
| Carcinogenics | CTUh | 4.02E-08 | 7.16E-11 | 4.10E-10 | 4.07E-08 |
| Non carcinogenics | CTUh | 2.43E-07 | 1.02E-08 | 1.18E-08 | 2.65E-07 |
| Respiratory effects | kg PM2.5 eq | 2.00E-03 | 9.86E-05 | 5.92E-05 | 2.16E-03 |
| Additional environmental information | |||||
| Ecotoxicity | CTUe | 6.65E+00 | 1.93E-01 | 6.20E-02 | 6.91E+00 |
| Fossil fuel depletion | MJ surplus | 2.65E+00 | 3.92E-01 | 1.20E-01 | 3.16E+00 |
| Resource use indicators | |||||
| Renewable primary energy used as energy carrier (fuel) | MJ, LHV | 2.21E+00 | 4.50E-03 | 1.71E+00 | 3.93E+00 |
| Renewable primary resources with energy content used as material | MJ, LHV | 0 | 0 | 0 | 0 |
| Total use of renewable primary resources with energy content | MJ, LHV | 2.21E+00 | 4.50E-03 | 1.71E+00 | 3.93E+00 |
| Non-renewable primary resources used as an energy carrier (fuel) | MJ, LHV | 4.20E+01 | 2.75E+00 | 1.26E+00 | 4.60E+01 |
| Non-renewable primary resources with energy content used as material | MJ, LHV | 0 | 0 | 0 | 0 |
| Total use of non-renewable primary resources with energy content | MJ, LHV | 4.20E+01 | 2.75E+00 | 1.26E+00 | 4.60E+01 |
| Secondary materials | kg | 0 | 0 | 0 | 0 |
| Renewable secondary fuels | MJ, LHV | 0 | 0 | 0 | 0 |
| Non-renewable secondary fuels | MJ, LHV | 0 | 0 | 0 | 0 |
| Recovered energy | MJ, LHV | 0 | 0 | 0 | 0 |
| Use of net fresh water resources | m3 | 9.49E+00 | 2.24E-02 | 1.52E+00 | 1.10E+01 |
| Abiotic depletion potential for fossil resources | MJ, LHV | 4.03E+01 | 2.74E+00 | 1.18E+00 | 4.42E+01 |
| Output flows and waste category indicators | |||||
| Hazardous waste disposed | kg | 0 | 0 | 0 | 0 |
| Non-hazardous waste disposed | kg | 0 | 0 | 0 | 0 |
| High-level radioactive waste, conditioned, to final repository | kg | 7.45E-06 | 3.49E-08 | 2.99E-07 | 7.78E-06 |
| Intermediate- and low-level radioactive waste, conditioned, to final repository | kg | 1.61E-05 | 6.67E-08 | 6.59E-07 | 1.68E-05 |
| Components for re-use | kg | 0 | 0 | 0 | 0 |
| Materials for recycling | kg | 4.28E-02 | 0 | 1.02E-01 | 1.45E-01 |
| Materials for energy recovery | kg | 0 | 0 | 6.48E-03 | 6.48E-03 |
| Exported energy | MJ, LHV | 0 | 0 | 0 | 0 |
| Carbon emissions and removals | |||||
| Biogenic Carbon Removal from Product | kg CO2 | 0 | 0 | 0 | 0 |
| Biogenic Carbon Emission from Product | kg CO2 | 0 | 0 | 0 | 0 |
| Biogenic Carbon Removal from Packaging | kg CO2 | 0 | 0 | -9.28E-02 | -9.28E-02 |
| Biogenic Carbon Emission from Packaging | kg CO2 | 0 | 0 | 0 | 0 |
| Biogenic Carbon Emission from Combustion of Waste from Renewable Sources Used in Production Processes | kg CO2 | 0 | 0 | 0 | 0 |
| Calcination Carbon Emissions | kg CO2 | 0 | 0 | 0 | 0 |
| Carbonation Carbon Removals | kg CO2 | 0 | 0 | 0 | 0 |
| Carbon Emissions from Combustion of Waste from Non-Renewable Sources used in Production Processes | kg CO2 | 0 | 0 | 0 | 0 |
LCIA results for a single bracket component
| Impact category | Unit | [A1] Extraction & upstream processing | [A2] Transport | [A3] Manufacturing | Cradle-to-gate total |
| Ozone depletion | kg CFC-11 eq | 6.54E-09 | 6.04E-10 | 6.79E-10 | 7.82E-09 |
| Global warming | kg CO2 eq | 8.35E-01 | 4.12E-02 | 2.42E-02 | 9.00E-01 |
| Smog | kg O3 eq | 3.18E-02 | 9.87E-03 | 9.45E-04 | 4.27E-02 |
| Acidification | kg SO2 eq | 2.29E-03 | 3.06E-04 | 9.39E-05 | 2.69E-03 |
| Eutrophication | kg N eq | 3.08E-04 | 1.94E-05 | 7.94E-06 | 3.36E-04 |
| Carcinogenics | CTUh | 9.48E-09 | 1.45E-11 | 4.01E-11 | 9.53E-09 |
| Non carcinogenics | CTUh | 6.71E-08 | 2.07E-09 | 7.68E-10 | 6.99E-08 |
| Respiratory effects | kg PM2.5 eq | 4.47E-04 | 1.96E-05 | 9.84E-06 | 4.76E-04 |
| Additional environmental information | |||||
| Ecotoxicity | CTUe | 1.39E+00 | 3.95E-02 | 4.29E-03 | 1.43E+00 |
| Fossil fuel depletion | MJ surplus | 7.47E-01 | 7.82E-02 | 5.67E-02 | 8.82E-01 |
LCIA results for 12 linear inches of metal rail
| Impact category | Unit | [A1] Extraction & upstream processing | [A2] Transport | [A3] Manufacturing | Cradle-to-gate total |
| Ozone depletion | kg CFC-11 eq | 7.20E-09 | 1.21E-09 | 2.81E-09 | 1.12E-08 |
| Global warming | kg CO2 eq | 1.44E+00 | 8.26E-02 | 2.92E-02 | 1.55E+00 |
| Smog | kg O3 eq | 5.05E-02 | 2.01E-02 | 2.86E-03 | 7.35E-02 |
| Acidification | kg SO2 eq | 3.80E-03 | 6.23E-04 | 1.60E-04 | 4.58E-03 |
| Eutrophication | kg N eq | 5.44E-04 | 3.95E-05 | 1.96E-05 | 6.03E-04 |
| Carcinogenics | CTUh | 1.54E-08 | 2.86E-11 | 1.85E-10 | 1.56E-08 |
| Non carcinogenics | CTUh | 8.77E-08 | 4.05E-09 | 5.53E-09 | 9.73E-08 |
| Respiratory effects | kg PM2.5 eq | 7.76E-04 | 3.95E-05 | 2.47E-05 | 8.40E-04 |
| Additional environmental information | |||||
| Ecotoxicity | CTUe | 2.63E+00 | 7.69E-02 | 2.89E-02 | 2.74E+00 |
| Fossil fuel depletion | MJ surplus | 9.51E-01 | 1.57E-01 | 3.17E-02 | 1.14E+00 |
MFI® S-Series system: LCIA scaling factors
| Impact category | MFI® S-Series system with S 16 ga rail | MFI® S-Series system with S 18 ga rail | |||||||||
| 3S bracket | 3.5S bracket | 4S bracket | 5S bracket | 6S bracket | 2S bracket | 3S bracket | 3.5S bracket | 4S bracket | 5S bracket | 6S bracket | |
| Ozone depletion | 1.07 | 1.06 | 1.07 | 1.10 | 1.14 | 0.91 | 0.98 | 0.98 | 0.99 | 1.02 | 1.06 |
| Global warming | 1.09 | 1.08 | 1.09 | 1.13 | 1.18 | 0.88 | 0.97 | 0.96 | 0.98 | 1.02 | 1.07 |
| Smog | 1.09 | 1.08 | 1.09 | 1.14 | 1.19 | 0.88 | 0.97 | 0.97 | 0.98 | 1.02 | 1.07 |
| Acidification | 1.08 | 1.08 | 1.09 | 1.13 | 1.18 | 0.89 | 0.97 | 0.96 | 0.97 | 1.01 | 1.06 |
| Eutrophication | 1.08 | 1.08 | 1.09 | 1.13 | 1.18 | 0.88 | 0.97 | 0.96 | 0.97 | 1.01 | 1.06 |
| Carcinogenics | 1.10 | 1.09 | 1.11 | 1.16 | 1.21 | 0.89 | 0.99 | 0.98 | 0.99 | 1.04 | 1.10 |
| Non carcinogenics | 1.11 | 1.10 | 1.12 | 1.17 | 1.23 | 0.89 | 1.00 | 0.99 | 1.01 | 1.06 | 1.12 |
| Respiratory effects | 1.08 | 1.08 | 1.09 | 1.13 | 1.18 | 0.88 | 0.97 | 0.96 | 0.97 | 1.01 | 1.06 |
| Additional environmenal information | |||||||||||
| Ecotoxicity | 1.09 | 1.08 | 1.10 | 1.14 | 1.19 | 0.88 | 0.97 | 0.96 | 0.98 | 1.02 | 1.07 |
| Fossil fuel depletion | 1.09 | 1.08 | 1.09 | 1.13 | 1.18 | 0.89 | 0.98 | 0.97 | 0.98 | 1.03 | 1.08 |