EPD additional content CELLU-SHIELD®
Data
Background This product-specific plant-specific declaration was created by collecting production data from the Isolatek team for product shipped from Warren, IN. Secondary data sources include those available in the ecoinvent v3.10 and US-EI 2.2 databases.
Allocation The PCR prescribes where and how allocation occurs. Since only facility-level data were available, allocation among the facility's other co-products was necessary to determine the energy consumption associated with the product. Allocation of energy was done on a mass basis for all products. Allocation of transportation was based on weight, since volume is not assumed to be limiting factor. For recycled content and disposal at end of life, system boundaries were drawn consistent with the cut-off allocation approach. Recycled newspaper, which is used as the cellulose material, is assumed to enter the system burden-free in that burden associated with the production of virgin cellulose is not allocated to the cellulose material life cycle. Likewise, the system boundary was drawn to include landfilling of the cellulose material at end-of-life (following the polluter pays principle) but exclude any credits from material or energy recovery.
Cut-off criteria for the inclusion of mass and energy flows are 1% of renewable primary resource (energy) usage, 1% nonrenewable primary resource (energy) usage, 1% of the total mass input of that unit process, and 1% of environmental impacts. The total of neglected input flows per module does not exceed 5% of energy usage, mass, and environmental impacts. The only exceptions to these criteria are substances with hazardous and toxic properties, which must be listed even when the given process unit is under the cut-off criterion of 1% of the total mass. No known flows are deliberately excluded from this declaration, and no substances required to be reported as hazardous are associated with the production of this product including upstream raw material supply and raw material manufacturing. Therefore, these criteria have been met. Biogenic carbon is included in reported results.
Quality Temporal and technological representativeness are considered to be high. Geographical representativeness is considered to be high. All relevant process steps for the product system were considered and modeled. The process chain is considered sufficiently complete with regards to the goal and scope of this study. The product system was checked for mass balance and completeness of the inventory. Capital goods were excluded since they are assumed not to significantly affect the conclusions of the LCA. Otherwise, no data were knowingly omitted. For more information on data quality, see the LCA background report.
LCIA impact factors required by the PCR are global warming, ozone depletion, acidification, eutrophication, smog, and fossil fuel depletion; “These six impact categories are globally deemed mature enough to be included in Type III environmental declarations. Other categories are being developed and defined and LCA should continue making advances in their development. However, the EPD users shall not use additional measures for comparative purposes.”
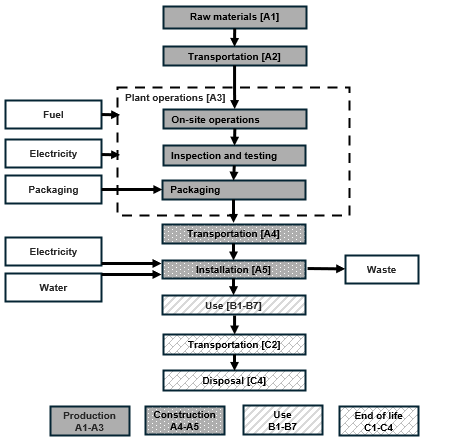
Flow diagram
Scenarios and additional technical information
| PARAMETER | VALUE |
UNIT |
| Transport to the building site [A4] |
||
| Fuel type | Diesel |
- |
| Vehicle type |
Truck and trailer (16-32 metric ton) |
- |
| Liters of fuel |
34.5 |
L/100 km |
| Average distance from manufacturing to installation site |
1,207 |
km |
| Capacity utilization |
50 |
% |
| Gross density: cellulose component |
1,710 |
kg/m³ |
| Gross density: uncured adhesive component |
1,198 |
kg/m³ |
| Installation into the building [A5] |
||
| Mass of packaging waste |
0.24 |
kg |
| Biogenic carbon content of pallet portion of packaging |
0.37 |
kg CO2 |
| Net freshwater consumption | 3.32 | kg |
| Electricity consumption | 0.09 | kWh |
| Mass of scrap waste |
0.128 |
kg |
| VOC content |
≤ 500 |
μg/m3 |
| End of life [C1-C4] |
||
| Assumptions for scenario development |
Following manual removal of the insulation, it was assumed to be transported 100 km to landfill, where no prior waste processing is required. |
|
| Removals of biogenic carbon (excluding packaging) | 0 | kg CO2 |
| Emissions of biogenic carbon (excluding packaging) | 3.03 | kg CO2 |
| Collection process |
Collected with mixed construction waste |
2.43 kg |
| Disposal |
Product for final deposition in landfill |
2.43 kg |
| Technical properties | |
| Dimensions/quantities delivered to installation site | Cellulosic material is delivered in 30lb bags, and adhesive is delivered in 55gal drums. |
| Bond strength | ASTM E 736; >150 psf |
| Class |
ASTM E 84/ UL 723; Class 1 Class A |
| Corrosivity |
ASTM C 739; Non-corrosive |
| Bond deflection |
ASTM E 759; 1" deflection in 10' span – no spalling or delamination |
| R-value |
ASTM C 518; 3.9 per inch |
| Building code | Comply with 2018 IBC Section 803.14 stability requirements for interior finishes |
| Product specification | Meet ASTM C 1149 |
| For more information about the product specifications, visit https://www.astm.org/ and https://codes.iccsafe.org/. | |
Major system boundary exclusions
- Construction of major capital equipment
- Maintenance of operation and support equipment
- Human labor and employee transport
- Building operational energy and water use not associated with final product
Major assumptions and limitations
- Variations in color choices are assumed to be negligible.
- Generic data sets used for material inputs, transport, and waste processing are considered good quality, but actual impacts from material suppliers, transport carriers, and local waste processing may vary.
- The impact assessment methodology categories do not represent all possible environmental impact categories.
- Characterization factors used within the impact assessment methodology may contain varying levels of uncertainty.
- LCA results are relative expressions and do not predict impacts on category endpoints, the exceeding of thresholds, safety margins or risks.
LCIA results, resource use, output and waste flows, and carbon emissions & removals per functional unit
| Parameter | Unit | A1-A3 | A4 |
A5 |
B1-B7 |
C1 |
C2 |
C3 |
C4 |
Total |
| LCIA results |
||||||||||
| Global warming | kg CO2 eq | 3.22E+00 | 6.07E-01 | 2.13E-01 | 0 | 0 | 3.21E-01 | 0 | 6.96E-01 | 5.06E+00 |
| Ozone depletion | kg CFC-11 eq | 7.90E-08 | 9.49E-09 | 3.15E-09 | 0 | 0 | 5.31E-09 | 0 | 7.70E-10 | 9.77E-08 |
| Acidification | kg SO2 eq | 1.57E-02 | 2.12E-03 | 4.97E-04 | 0 | 0 | 1.57E-03 | 0 | 2.84E-04 | 2.01E-02 |
| Eutrophication | kg N eq | 2.04E-03 | 1.41E-04 | 1.70E-04 | 0 | 0 | 9.93E-05 | 0 | 9.48E-04 | 3.40E-03 |
| Smog | kg O3 eq | 2.09E-01 | 6.05E-02 | 9.96E-03 | 0 | 0 | 4.82E-02 | 0 | 4.83E-03 | 3.33E-01 |
| Fossil fuel depletion | MJ surplus | 7.20E+00 | 1.17E+00 | 1.73E-01 | 0 | 0 | 6.02E-01 | 0 | 8.16E-02 | 9.23E+00 |
| Additional environmental information |
||||||||||
| Respiratory effects | kg PM2.5 eq | 2.43E-03 | 2.14E-04 | 4.82E-05 | 0 | 0 | 1.96E-04 | 0 | 3.49E-05 | 2.92E-03 |
| Carcinogenics | CTUh | 91.7% | 3.3% | 1.3% | 0% | 0% | 0.6% | 0% | 3.1% | 100% |
| Non carcinogenics | CTUh | 68.4% | 15.6% | 1.8% | 0% | 0% | 2.9% | 0% | 11.3% | 100% |
| Ecotoxicity | CTUe | 56.5% | 37.4% | 0.9% | 0% | 0% | 1.0% | 0% | 4.2% | 100% |
| Resource use indicators |
||||||||||
| Renewable primary energy used as energy carrier (fuel) |
MJ, NCV |
5.42E+00 |
1.35E-02 |
8.45E-02 |
0 |
0 |
8.06E-03 |
0 |
1.12E-02 |
5.53E+00 |
| Renewable primary resources with energy content used as material |
MJ, NCV |
3.39E+01 |
0 |
0 |
0 |
0 |
0 |
0 |
0 |
3.39E+01 |
| Total renewable primary resources |
MJ, NCV |
3.93E+01 |
1.35E-02 |
8.45E-02 |
0 |
0 |
8.06E-03 |
0 |
1.12E-02 |
3.94E+01 |
| Non-renewable primary resources used as an energy carrier (fuel) |
MJ, NCV |
2.19E+01 |
8.80E+00 |
1.80E+00 |
0 |
0 |
4.47E+00 |
0 |
6.66E-01 |
3.76E+01 |
| Non-renewable primary resources with energy content used as material |
MJ, NCV |
4.68E+01 |
0 |
0 |
0 |
0 |
0 |
0 |
0 |
4.68E+01 |
| Total non-renewable primary resources |
MJ, NCV |
6.87E+01 |
8.80E+00 |
1.80E+00 |
0 |
0 |
4.47E+00 |
0 |
6.66E-01 |
8.45E+01 |
| Secondary materials |
kg |
1.67E+00 |
0 |
0 |
0 |
0 |
0 |
0 |
0 |
1.67E+00 |
| Renewable secondary fuels |
MJ, NCV |
0 |
0 |
0 |
0 |
0 |
0 |
0 |
0 |
0.00E+00 |
| Non-renewable secondary fuels |
MJ, NCV |
0 |
0 |
0 |
0 |
0 |
0 |
0 |
0 |
0.00E+00 |
| Recovered energy |
MJ, NCV |
0 |
0 |
0 |
0 |
0 |
0 |
0 |
0 |
0.00E+00 |
| Use of net fresh water resources |
m3 |
1.21E+01 |
1.36E-01 |
3.27E-01 |
0 |
0 |
9.16E-02 |
0 |
7.02E-02 |
1.27E+01 |
| Abiotic depletion potential, fossil |
MJ, NCV |
5.99E+01 |
8.26E+00 |
1.40E+00 |
0 |
0 |
4.19E+00 |
0 |
6.11E-01 |
7.44E+01 |
| Output flows and waste category indicators |
||||||||||
| Hazardous waste disposed |
kg |
0 |
0 |
0 |
0 |
0 |
0 |
0 |
0 |
0.00E+00 |
| Non-hazardous waste disposed |
kg |
0 |
0 |
3.44E-01 |
0 |
0 |
0 |
0 |
2.43E+00 |
2.77E+00 |
| High-level radioactive waste |
kg |
1.62E-05 |
9.88E-08 |
8.76E-07 |
0 |
0 |
5.70E-08 |
0 |
6.54E-08 |
1.73E-05 |
| Intermediate- and low-level radioactive waste, conditioned, to final repository |
kg |
3.78E-05 |
1.94E-07 |
1.96E-06 |
0 |
0 |
1.30E-07 |
0 |
1.64E-07 |
4.02E-05 |
| Components for re-use |
kg |
0 |
0 |
0 |
0 |
0 |
0 |
0 |
0 |
0.00E+00 |
| Materials for recycling |
kg |
0 |
0 |
0 |
0 |
0 |
0 |
0 |
0 |
0.00E+00 |
| Materials for energy recovery |
kg |
0 |
0 |
0 |
0 |
0 |
0 |
0 |
0 |
0.00E+00 |
| Exported energy |
MJ, LHV |
0 |
0 |
0 |
0 |
0 |
0 |
0 |
0 |
0.00E+00 |
| Carbon emissions and removals |
||||||||||
| Biogenic carbon removal from product |
kg CO2 |
3.19E+00 |
0 |
0 |
0 |
0 |
0 |
0 |
0 |
3.19E+00 |
| Biogenic carbon emission from product |
kg CO2 |
0 |
0 |
1.60E-01 |
0 |
0 |
0 |
0 |
3.03E+00 |
3.19E+00 |
| Biogenic carbon removal from packaging |
kg CO2 |
3.65E-01 |
0 |
0 |
0 |
0 |
0 |
0 |
0 |
3.65E-01 |
| Biogenic carbon emission from packaging |
kg CO2 |
0 |
0 |
3.65E-01 |
0 |
0 |
0 |
0 |
0 |
3.65E-01 |
| Biogenic carbon emission from combustion of waste |
kg CO2 |
0 |
0 |
0 |
0 |
0 |
0 |
0 |
0 |
0.00E+00 |
| Calcination carbon emissions |
kg CO2 |
0 |
0 |
0 |
0 |
0 |
0 |
0 |
0 |
0.00E+00 |
| Carbonation carbon removals |
kg CO2 |
0 |
0 |
0 |
0 |
0 |
0 |
0 |
0 |
0.00E+00 |
| Carbon emissions from combustion of waste from renewable sources used in production processes + Carbon emissions from combustion of waste from non renewable sources used in production processes |
kg CO2 |
0 |
0 |
0 |
0 |
0 |
0 |
0 |
0 |
0.00E+00 |