LCA results & interpretation FENDOLITE® M-II & M-II/P

Scope and summary

  • Cradle to gate
  • Cradle to gate with options
  • Cradle to grave

Application

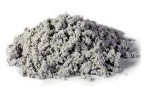
FENDOLITE® Series products for commercial use are vermiculite and Portland cement based, wet mix, high density Spray-Applied Fire Resistive Materials (SFRMs) designed to provide fire protection to structural columns and beams in exterior environments and interior situations where the highest levels of abrasion resistance and hardness are necessary.

Declared unit

1,000 kg of spray-applied fire-resistive material, packaging included.

Manufacturing activities

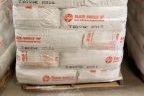
Products are manufactured by blending the specified bulking agent with a number of product-specific binders to achieve prescribed fire rating performance in the field. Finished goods are packaged in individual bags, stacked on pallets, and stretch wrapped before delivery to job sites.

Manufacturing data

Reporting period: January 2024 – December 2024
Locations: San Bernardino, CA; Stanhope, NJ; and Houston, TX

Distribution and installation scenarios

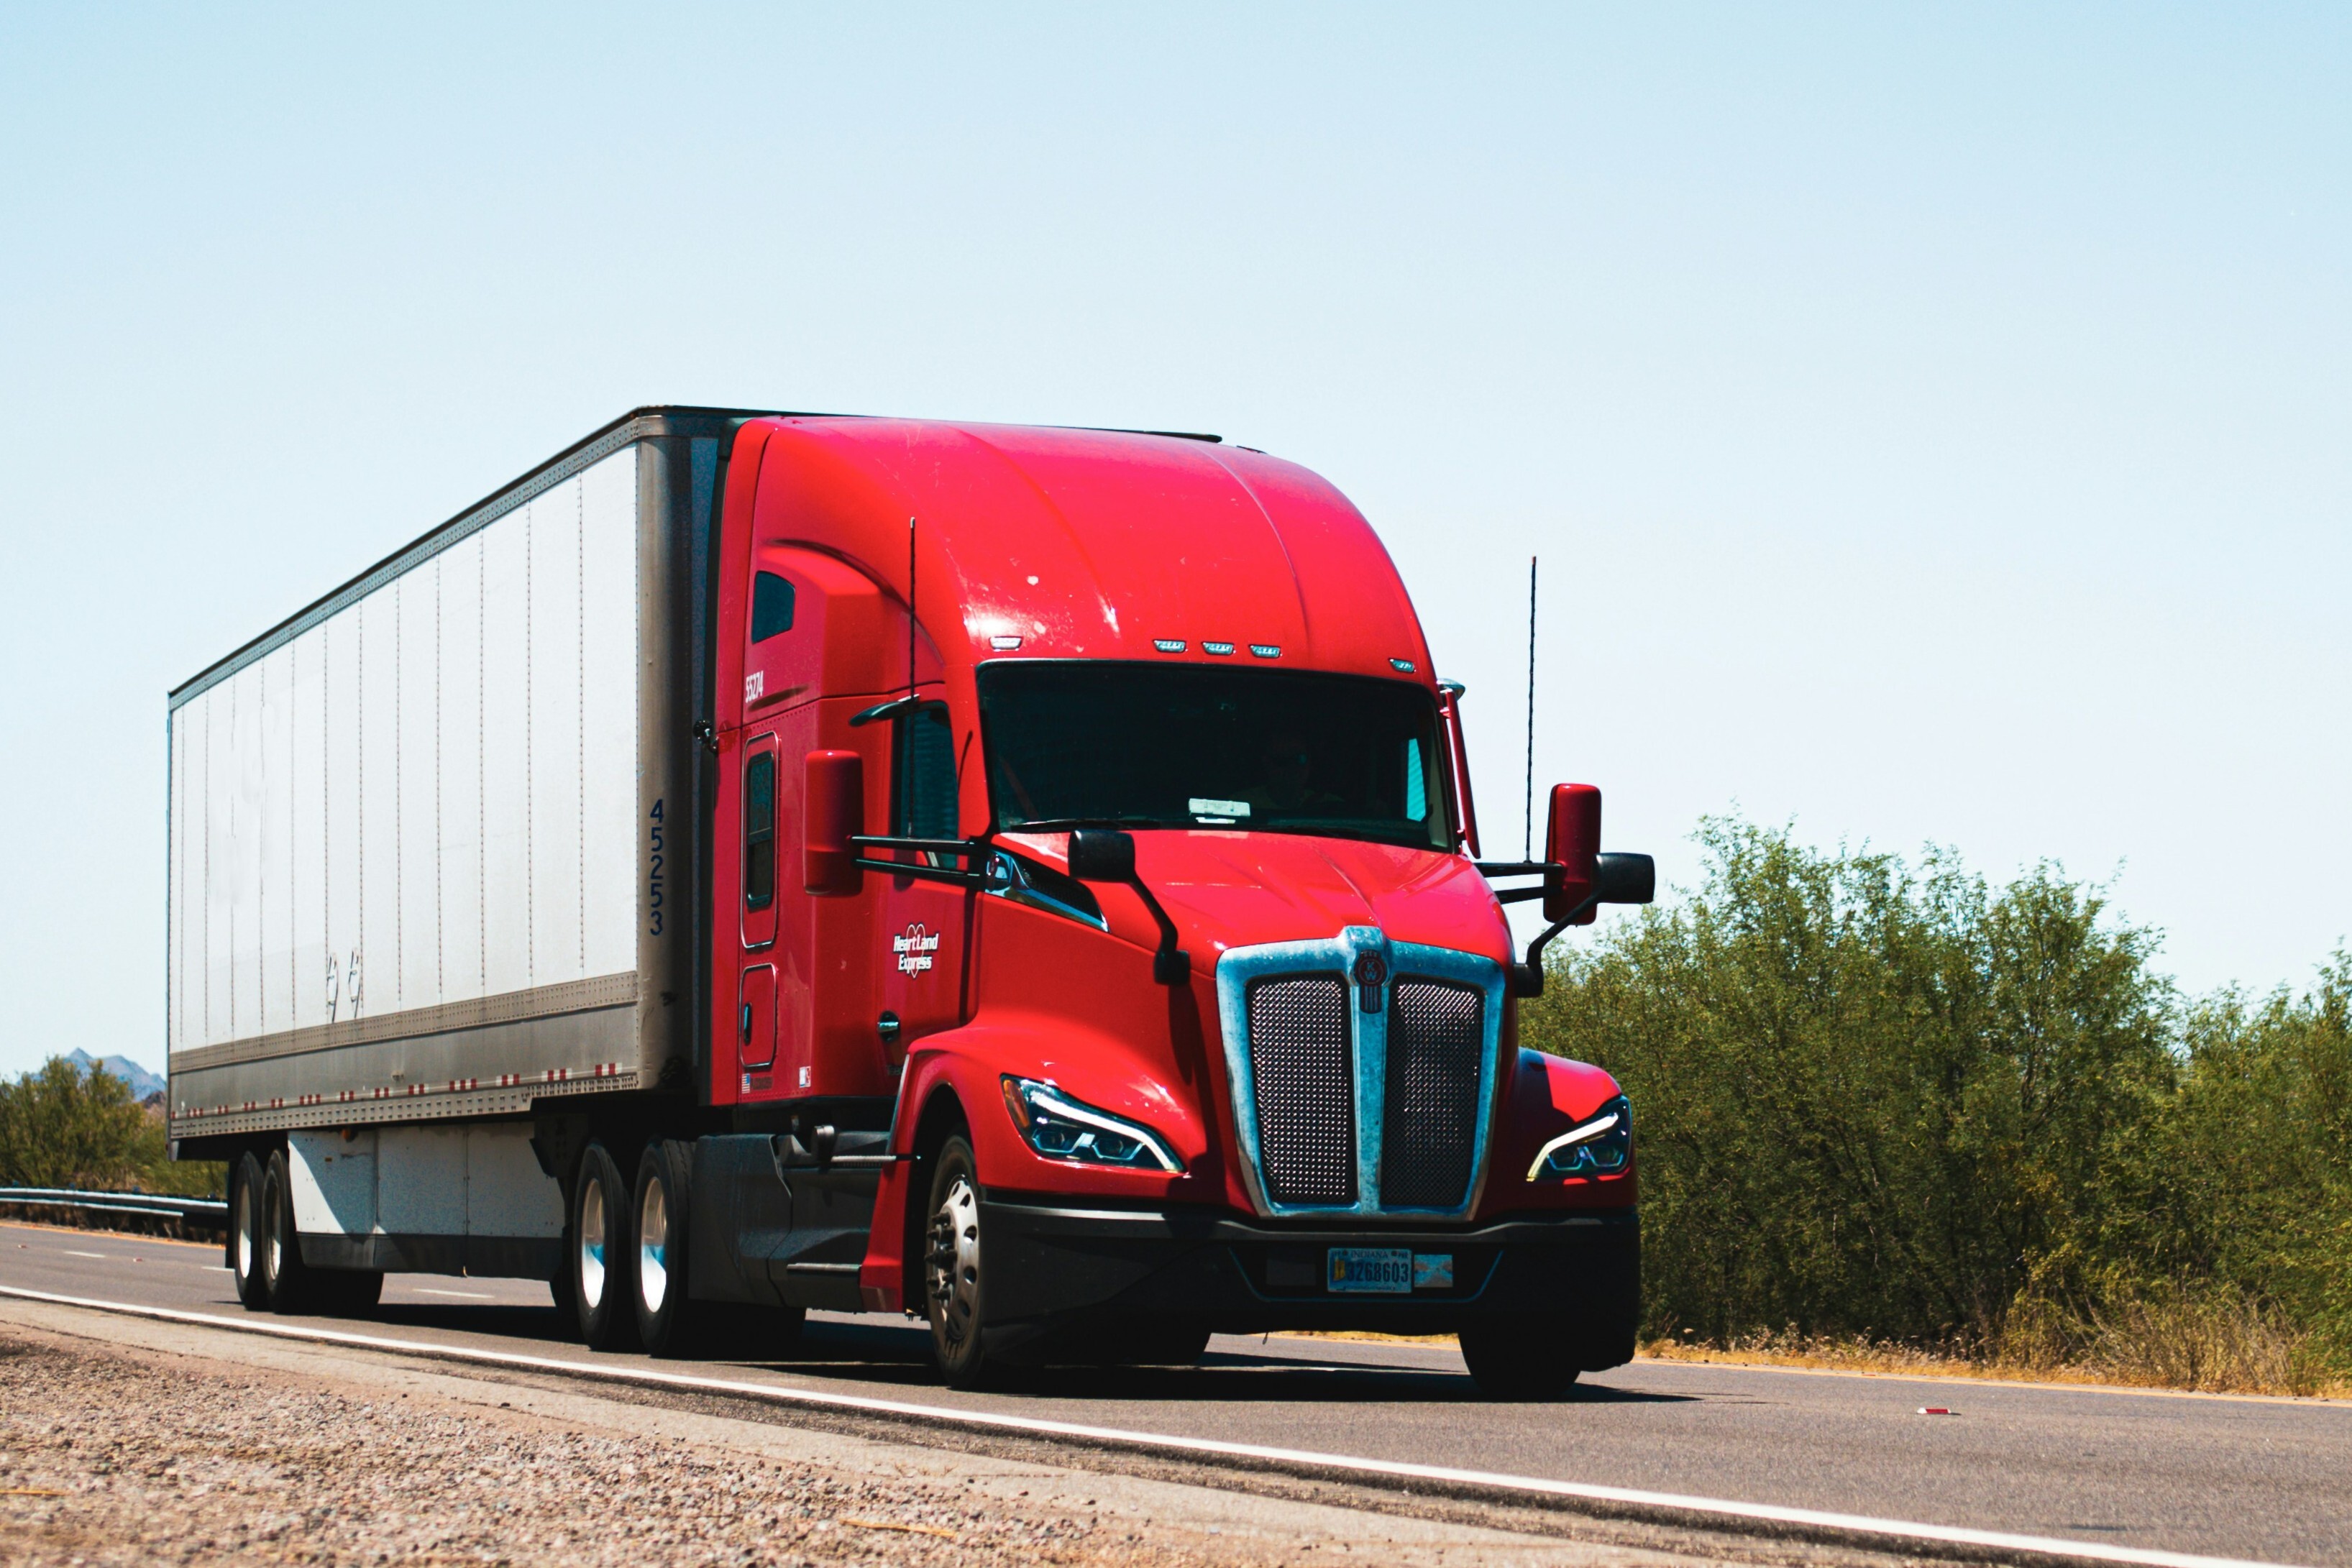
The product belongs to the FENDOLITE M-II SFRM subcategory, as the product density is greater than 35 pcf (561 kg/m3). Distribution from the manufacturing facility to the construction site is assumed to be 500 km (311 miles) using a single unit truck with an empty backhaul. 0.875 m³ of water and 11 kWh of electricity is assumed to be consumed during installation.

No gasoline or diesel-powered equipment is assumed to be used during installation. Therefore, the net calorific value (i.e., Lower Heating Value, LHV) of fuels is considered to be zero in A5.

What’s causing the greatest impacts

All life cycle stages

The environmental impacts are primarily driven by the raw material supply phase. The raw material extraction and upstream processing stage dominates across all impact categories except for the non-carcinogens category. Following this, the raw material transportation, manufacturing, and transport to the building site phases contribute comparable levels of impact. The installation stage results in the lowest overall impacts.

Raw material supply

The raw material supply phase is the most significant contributor, accounting for over 70% of the total global warming potential under both the IPCC AR6 and TRACI 2.2 methodologies.

This impact is largely driven by the use of Portland cement and vermiculite. Portland cement accounts for about 70% and vermiculite accounts for about 15% of CO₂-equivalent emissions within this phase. Raw material supply is also the dominant contributor accounting for 50–80% of the total impacts in most categories, with the exception of non-carcinogenics.

Transport to factory

The transport to factory phase makes a significant contribution to the non-carcinogenics category, particularly for products manufactured at the San Bernardino, CA and Houston, TX plants. In contrast, for products manufactured at the Stanhope, NJ facility, transportation to the building site has a higher impact in this category compared to transport to the factory. The primary driver of non-carcinogenic effects during this phase is the inbound transport of raw materials, which leads to emissions of nitrogen oxides (NOₓ) and particulate matter, both known to cause potential non-carcinogenic health effects.

Manufacturing and transport to building site

The manufacturing and transport to building site phases contribute similarly to results. For global warming potential, their impacts range between 4% and 6%.

Installation

The installation phase has a minimal overall impact. Its contribution to the global warming potential is between 3% and 4%. In the freshwater eutrophication category, approximately 5% of the impact originates from phase A5. Across all other impact categories, this phase contributes even less.

Embodied carbon

Embodied carbon can be defined as the cradle-to-gate (A1-A3) IPCCTotal global warming potential impacts. The embodied carbon per declared unit of FENDOLITE® M-II is 8.48E+02 kg CO2-eq for San Bernardino, 7.40E+02 kg CO2-eq for Stanhope, and 8.13E+02 kg CO2-eq for Houston.

How we're making it greener

Isolatek International is committed to legal compliance and ethical business practices in all of our operations. Isolatek's vendors must act in accordance with the applicable statutory and international standards regarding environmental protection. Isolatek's vendors must minimize environmental pollution and make continuous improvements in environmental protection.

Isolatek's vendors must set up or use a reasonable environmental management system. In Isolatek's purchase arrangements, vendors must observe all applicable laws of their country and international standards, including but not limited to laws and standards relating to the environment, as well as health and safety.

See how we make it greener

LCA results

Life cycle stage Raw material supply Transportation Manufacturing Transportation Installation

Information modules:
Included (X)
| Excluded (MND)*

*Modules B, C, and D are excluded.

(X) A1 Raw Material extraction and upstream processing (X) A2 Transport to factory (X) A3 Manufacturing (X) A4 Transport to building site (X) A5 Installation
  • A variation of 10 to 20%
  • |
  • A variation greater than 20%
  • Impacts per declared unit 2.19E+01 mPts 5.26E+00 mPts 2.27E+00 mPts 2.84E+00 mPts 3.73E-01 mPts
    Materials or processes contributing >20% to total impacts in each life cycle stage Raw extraction and upstream manufacturing. Truck and rail transportation used to transport raw materials to manufacturing site. Energy and ancillary materials required to make the passive fire protection product. Truck and rail transportation used to transport finished products to construction site. Energy and water used for installation.

    TRACI v2.2 results per declared unit - FENDOLITE® M-II produced in San Bernardino, CA

    Life cycle stage A1 Raw material supply A2 Transport A3 Manufacturing A4 Transport to building site A5 Installation

    Ecological damage

    Impact category Unit
    GWP, IPCCTotal kg CO2 eqKilograms of Carbon Dioxide equivalent
    Global warming is an average increase in the temperature of the atmosphere near the Earth’s surface and in the troposphere, which can contribute to change in global climate patterns and is caused by the increase of the sources of greenhouse gases and decrease of the sinks due to deforestation and land use. GW leads to problems in human health, agriculture, forest, water source, and damage to species and biodiversity as well as coastal areas.
    6.69E+02 1.32E+02 3.16E+01 4.16E+01 2.76E+01
    GWP, IPCCBiogenic kg CO2 eqKilograms of Carbon Dioxide equivalent
    Global warming is an average increase in the temperature of the atmosphere near the Earth’s surface and in the troposphere, which can contribute to change in global climate patterns and is caused by the increase of the sources of greenhouse gases and decrease of the sinks due to deforestation and land use. GW leads to problems in human health, agriculture, forest, water source, and damage to species and biodiversity as well as coastal areas.
    0.00E+00 0.00E+00 -2.15E+01 0.00E+00 2.15E+01
    GWP, IPCCFossil kg CO2 eqKilograms of Carbon Dioxide equivalent
    Global warming is an average increase in the temperature of the atmosphere near the Earth’s surface and in the troposphere, which can contribute to change in global climate patterns and is caused by the increase of the sources of greenhouse gases and decrease of the sinks due to deforestation and land use. GW leads to problems in human health, agriculture, forest, water source, and damage to species and biodiversity as well as coastal areas.
    6.69E+02 1.32E+02 5.31E+01 4.16E+01 6.08E+00
    GWP, IPCCLuluc kg CO2 eqKilograms of Carbon Dioxide equivalent
    Global warming is an average increase in the temperature of the atmosphere near the Earth’s surface and in the troposphere, which can contribute to change in global climate patterns and is caused by the increase of the sources of greenhouse gases and decrease of the sinks due to deforestation and land use. GW leads to problems in human health, agriculture, forest, water source, and damage to species and biodiversity as well as coastal areas.
    1.21E-01 7.03E-03 3.96E-02 2.21E-03 3.54E-03
    GWP, TRACITotal kg CO2 eqKilograms of Carbon Dioxide equivalent
    Global warming is an average increase in the temperature of the atmosphere near the Earth’s surface and in the troposphere, which can contribute to change in global climate patterns and is caused by the increase of the sources of greenhouse gases and decrease of the sinks due to deforestation and land use. GW leads to problems in human health, agriculture, forest, water source, and damage to species and biodiversity as well as coastal areas.
    6.66E+02 1.31E+02 3.06E+01 4.10E+01 3.15E+01
    GWP, TRACIBiogenic kg CO2 eqKilograms of Carbon Dioxide equivalent
    Global warming is an average increase in the temperature of the atmosphere near the Earth’s surface and in the troposphere, which can contribute to change in global climate patterns and is caused by the increase of the sources of greenhouse gases and decrease of the sinks due to deforestation and land use. GW leads to problems in human health, agriculture, forest, water source, and damage to species and biodiversity as well as coastal areas.
    0.00E+00 0.00E+00 -2.15E+01 0.00E+00 2.15E+01
    GWP, TRACIFossil kg CO2 eqKilograms of Carbon Dioxide equivalent
    Global warming is an average increase in the temperature of the atmosphere near the Earth’s surface and in the troposphere, which can contribute to change in global climate patterns and is caused by the increase of the sources of greenhouse gases and decrease of the sinks due to deforestation and land use. GW leads to problems in human health, agriculture, forest, water source, and damage to species and biodiversity as well as coastal areas.
    6.66E+02 1.31E+02 5.21E+01 4.10E+01 1.01E+01
    Ozone depletion kg CFC-11 eq Kilograms of Trichlorofluoromethane equivalent
    Ozone depletion is the reduction of ozone in the stratosphere caused by the release of ozone depleting chemicals. Ozone depletion can increases ultraviolet B radiation to the earth which can adversely affect human health (skin cancer and cataracts and immune-system suppression) and other systems (marine life, agricultural crops, and other vegetation) and causes damage to human-built materials.
    2.55E-06 1.78E-06 1.01E-06 5.59E-07 2.17E-08
    Acidification kg SO2 eq Kilograms of Sulfur Dioxide equivalent
    Acidification processes increase the acidity of water and soil systems and causes damage to lakes, streams, rivers, and various plants and animals, as well as building materials, paints, and other human-built structures.
    1.19E-06 5.09E-08 6.42E-08 1.60E-08 2.39E-08
    Marine eutrophication kg N eqKilograms of Nitrogen equivalent
    Marine eutrophication is the enrichment of an aquatic ecosystem with nutrients (nitrates and phosphates) that accelerate biological productivity (growth of algae and weeds) and an undesirable accumulation of algal biomass which impacts industry, agriculture, drinking, fishing, and recreation and causes death of fish and shellfish, toxicity to humans, marine mammals and livestock, and reduces biodiversity.
    4.49E-01 1.02E-01 1.83E-02 3.22E-02 1.93E-03
    Freshwater eutrophication kg P eq kilograms of phosphorus equivalents
    Freshwater eutrophication is the enrichment of an aquatic ecosystem with nutrients (phosphates) that accelerate biological productivity (growth of algae and weeds) and an undesirable accumulation of algal biomass.
    3.84E-03 4.19E-04 8.25E-04 1.32E-04 2.61E-04

    TRACI v2.2 results per declared unit - FENDOLITE® M-II produced in Stanhope, NJ

    Life cycle stage A1 Raw material supply A2 Transport A3 Manufacturing A4 Transport to building site A5 Installation

    Ecological damage

    Impact category Unit
    GWP, IPCCTotal kg CO2 eqKilograms of Carbon Dioxide equivalent
    Global warming is an average increase in the temperature of the atmosphere near the Earth’s surface and in the troposphere, which can contribute to change in global climate patterns and is caused by the increase of the sources of greenhouse gases and decrease of the sinks due to deforestation and land use. GW leads to problems in human health, agriculture, forest, water source, and damage to species and biodiversity as well as coastal areas.
    6.53E+02 3.33E+01 3.74E+01 4.16E+01 2.65E+01
    GWP, IPCCBiogenic kg CO2 eqKilograms of Carbon Dioxide equivalent
    Global warming is an average increase in the temperature of the atmosphere near the Earth’s surface and in the troposphere, which can contribute to change in global climate patterns and is caused by the increase of the sources of greenhouse gases and decrease of the sinks due to deforestation and land use. GW leads to problems in human health, agriculture, forest, water source, and damage to species and biodiversity as well as coastal areas.
    0.00E+00 0.00E+00 -2.04E+01 0.00E+00 2.04E+01
    GWP, IPCCFossil kg CO2 eqKilograms of Carbon Dioxide equivalent
    Global warming is an average increase in the temperature of the atmosphere near the Earth’s surface and in the troposphere, which can contribute to change in global climate patterns and is caused by the increase of the sources of greenhouse gases and decrease of the sinks due to deforestation and land use. GW leads to problems in human health, agriculture, forest, water source, and damage to species and biodiversity as well as coastal areas.
    6.53E+02 3.33E+01 5.78E+01 4.16E+01 6.08E+00
    GWP, IPCCLuluc kg CO2 eqKilograms of Carbon Dioxide equivalent
    Global warming is an average increase in the temperature of the atmosphere near the Earth’s surface and in the troposphere, which can contribute to change in global climate patterns and is caused by the increase of the sources of greenhouse gases and decrease of the sinks due to deforestation and land use. GW leads to problems in human health, agriculture, forest, water source, and damage to species and biodiversity as well as coastal areas.
    1.22E-01 1.77E-03 3.77E-02 2.21E-03 3.54E-03
    GWP, TRACITotal kg CO2 eqKilograms of Carbon Dioxide equivalent
    Global warming is an average increase in the temperature of the atmosphere near the Earth’s surface and in the troposphere, which can contribute to change in global climate patterns and is caused by the increase of the sources of greenhouse gases and decrease of the sinks due to deforestation and land use. GW leads to problems in human health, agriculture, forest, water source, and damage to species and biodiversity as well as coastal areas.
    6.50E+02 3.29E+01 3.64E+01 4.10E+01 3.02E+01
    GWP, TRACIBiogenic kg CO2 eqKilograms of Carbon Dioxide equivalent
    Global warming is an average increase in the temperature of the atmosphere near the Earth’s surface and in the troposphere, which can contribute to change in global climate patterns and is caused by the increase of the sources of greenhouse gases and decrease of the sinks due to deforestation and land use. GW leads to problems in human health, agriculture, forest, water source, and damage to species and biodiversity as well as coastal areas.
    0.00E+00 0.00E+00 -2.04E+01 0.00E+00 2.04E+01
    GWP, TRACIFossil kg CO2 eqKilograms of Carbon Dioxide equivalent
    Global warming is an average increase in the temperature of the atmosphere near the Earth’s surface and in the troposphere, which can contribute to change in global climate patterns and is caused by the increase of the sources of greenhouse gases and decrease of the sinks due to deforestation and land use. GW leads to problems in human health, agriculture, forest, water source, and damage to species and biodiversity as well as coastal areas.
    6.50E+02 3.29E+01 5.68E+01 4.10E+01 9.85E+00
    Ozone depletion kg CFC-11 eq Kilograms of Trichlorofluoromethane equivalent
    Ozone depletion is the reduction of ozone in the stratosphere caused by the release of ozone depleting chemicals. Ozone depletion can increases ultraviolet B radiation to the earth which can adversely affect human health (skin cancer and cataracts and immune-system suppression) and other systems (marine life, agricultural crops, and other vegetation) and causes damage to human-built materials.
    2.56E-06 4.48E-07 1.86E-06 5.59E-07 2.16E-08
    Acidification kg SO2 eq Kilograms of Sulfur Dioxide equivalent
    Acidification processes increase the acidity of water and soil systems and causes damage to lakes, streams, rivers, and various plants and animals, as well as building materials, paints, and other human-built structures.
    1.15E-06 1.28E-08 6.80E-08 1.60E-08 2.37E-08
    Marine eutrophication kg N eqKilograms of Nitrogen equivalent
    Marine eutrophication is the enrichment of an aquatic ecosystem with nutrients (nitrates and phosphates) that accelerate biological productivity (growth of algae and weeds) and an undesirable accumulation of algal biomass which impacts industry, agriculture, drinking, fishing, and recreation and causes death of fish and shellfish, toxicity to humans, marine mammals and livestock, and reduces biodiversity.
    4.47E-01 2.58E-02 2.01E-02 3.22E-02 1.90E-03
    Freshwater eutrophication kg P eq kilograms of phosphorus equivalents
    Freshwater eutrophication is the enrichment of an aquatic ecosystem with nutrients (phosphates) that accelerate biological productivity (growth of algae and weeds) and an undesirable accumulation of algal biomass.
    3.81E-03 1.05E-04 8.54E-04 1.32E-04 2.58E-04

    TRACI v2.2 results per declared unit - FENDOLITE® M-II produced in Houston, TX

    Life cycle stage A1 Raw material supply A2 Transport A3 Manufacturing A4 Transport to building site A5 Installation

    Ecological damage

    Impact category Unit
    GWP, IPCCTotal kg CO2 eqKilograms of Carbon Dioxide equivalent
    Global warming is an average increase in the temperature of the atmosphere near the Earth’s surface and in the troposphere, which can contribute to change in global climate patterns and is caused by the increase of the sources of greenhouse gases and decrease of the sinks due to deforestation and land use. GW leads to problems in human health, agriculture, forest, water source, and damage to species and biodiversity as well as coastal areas.
    6.85E+02 6.53E+01 4.50E+01 4.16E+01 2.97E+01
    GWP, IPCCBiogenic kg CO2 eqKilograms of Carbon Dioxide equivalent
    Global warming is an average increase in the temperature of the atmosphere near the Earth’s surface and in the troposphere, which can contribute to change in global climate patterns and is caused by the increase of the sources of greenhouse gases and decrease of the sinks due to deforestation and land use. GW leads to problems in human health, agriculture, forest, water source, and damage to species and biodiversity as well as coastal areas.
    0.00E+00 0.00E+00 -2.36E+01 0.00E+00 2.36E+01
    GWP, IPCCFossil kg CO2 eqKilograms of Carbon Dioxide equivalent
    Global warming is an average increase in the temperature of the atmosphere near the Earth’s surface and in the troposphere, which can contribute to change in global climate patterns and is caused by the increase of the sources of greenhouse gases and decrease of the sinks due to deforestation and land use. GW leads to problems in human health, agriculture, forest, water source, and damage to species and biodiversity as well as coastal areas.
    6.85E+02 6.53E+01 6.86E+01 4.16E+01 6.09E+00
    GWP, IPCCLuluc kg CO2 eqKilograms of Carbon Dioxide equivalent
    Global warming is an average increase in the temperature of the atmosphere near the Earth’s surface and in the troposphere, which can contribute to change in global climate patterns and is caused by the increase of the sources of greenhouse gases and decrease of the sinks due to deforestation and land use. GW leads to problems in human health, agriculture, forest, water source, and damage to species and biodiversity as well as coastal areas.
    1.17E-01 3.47E-03 4.38E-02 2.21E-03 3.55E-03
    GWP, TRACITotal kg CO2 eqKilograms of Carbon Dioxide equivalent
    Global warming is an average increase in the temperature of the atmosphere near the Earth’s surface and in the troposphere, which can contribute to change in global climate patterns and is caused by the increase of the sources of greenhouse gases and decrease of the sinks due to deforestation and land use. GW leads to problems in human health, agriculture, forest, water source, and damage to species and biodiversity as well as coastal areas.
    6.82E+02 6.44E+01 4.39E+01 4.10E+01 3.40E+01
    GWP, TRACIBiogenic kg CO2 eqKilograms of Carbon Dioxide equivalent
    Global warming is an average increase in the temperature of the atmosphere near the Earth’s surface and in the troposphere, which can contribute to change in global climate patterns and is caused by the increase of the sources of greenhouse gases and decrease of the sinks due to deforestation and land use. GW leads to problems in human health, agriculture, forest, water source, and damage to species and biodiversity as well as coastal areas.
    0.00E+00 0.00E+00 -2.36E+01 0.00E+00 2.36E+01
    GWP, TRACIFossil kg CO2 eqKilograms of Carbon Dioxide equivalent
    Global warming is an average increase in the temperature of the atmosphere near the Earth’s surface and in the troposphere, which can contribute to change in global climate patterns and is caused by the increase of the sources of greenhouse gases and decrease of the sinks due to deforestation and land use. GW leads to problems in human health, agriculture, forest, water source, and damage to species and biodiversity as well as coastal areas.
    6.82E+02 6.44E+01 6.74E+01 4.10E+01 1.05E+01
    Ozone depletion kg CFC-11 eq Kilograms of Trichlorofluoromethane equivalent
    Ozone depletion is the reduction of ozone in the stratosphere caused by the release of ozone depleting chemicals. Ozone depletion can increases ultraviolet B radiation to the earth which can adversely affect human health (skin cancer and cataracts and immune-system suppression) and other systems (marine life, agricultural crops, and other vegetation) and causes damage to human-built materials.
    2.57E-06 8.79E-07 1.16E-06 5.59E-07 2.18E-08
    Acidification kg SO2 eq Kilograms of Sulfur Dioxide equivalent
    Acidification processes increase the acidity of water and soil systems and causes damage to lakes, streams, rivers, and various plants and animals, as well as building materials, paints, and other human-built structures.
    1.24E-06 2.51E-08 7.76E-08 1.60E-08 2.43E-08
    Marine eutrophication kg N eqKilograms of Nitrogen equivalent
    Marine eutrophication is the enrichment of an aquatic ecosystem with nutrients (nitrates and phosphates) that accelerate biological productivity (growth of algae and weeds) and an undesirable accumulation of algal biomass which impacts industry, agriculture, drinking, fishing, and recreation and causes death of fish and shellfish, toxicity to humans, marine mammals and livestock, and reduces biodiversity.
    4.31E-01 5.05E-02 2.29E-02 3.22E-02 1.97E-03
    Freshwater eutrophication kg P eq kilograms of phosphorus equivalents
    Freshwater eutrophication is the enrichment of an aquatic ecosystem with nutrients (phosphates) that accelerate biological productivity (growth of algae and weeds) and an undesirable accumulation of algal biomass.
    3.75E-03 2.07E-04 1.05E-03 1.32E-04 2.65E-04

    References

    LCA Background Report
    LCA of Isolatek International Passive Fire Protection Products (public version), Isolatek 2025. Developed using the TRACI v2.2, IPCC 2021 AR6, CML, and Cumulative Energy Demand (LHV) impact assessment methodologies, SimaPro Craft 10.2 software, and ecoinvent v3.11 database.

    ISO 14025, “Sustainability in buildings and civil engineering works -- Core rules for environmental product declarations of construction products and services”

    ISO 21930:2007, "Sustainability in Building Construction — Environmental Declaration of Building Products" serves as the core PCR.

    Smart EPD Part A product category rules for building and construction products and services; Version 1.2, March 2025. PCR review conducted by Jack Geibig (chair, [email protected]); Terrie Boguski; and Hugues Imbeault-Tétreault.

    Smart EPD Part B product category rules for Spray-applied Fire-Resistive Materials (SFRM); Version 4.0, January 2025. PCR review conducted by Thomas Gloria, PhD (chair, [email protected]); Karl Houser; and Jack Geibig.

    Smart EPD General Program Instructions

    Download PDF SM Transparency Report/ EPD

    SM Transparency Reports (TR) are ISO 14025 Type III environmental declarations (EPD) that enable purchasers and users to compare the potential environmental performance of products on a life cycle basis. They are designed to present information transparently to make the limitations of comparability more understandable. Environmental declarations of products that conform to the same PCR and include the same life cycle stages, but are made by different manufacturers, may not sufficiently align to support direct comparisons. They therefore cannot be used as comparative assertions unless the conditions as defined in ISO 14025 Section 6.7.2. ‘Requirements for Comparability’ are satisfied. In order to support comparative assertions, this EPD meets all comparability requirements stated in ISO 14025:2006. However, differences in certain assumptions, data quality, and variability between LCA data sets may still exist. Example of variations: Different LCA software and background LCI datasets may lead to differences in results upstream or downstream of the life cycle stages declared. EPDs are only comparable if they conform with ISO 21930, this sub-category PCR, include all relevant information modules and are based on equivalent scenarios with respect to the construction works context. Some LCA impact categories and inventory items are still under development and can have high levels of uncertainty. The science supporting this additional environmental information is still under development and may have high levels of uncertainty that preclude international acceptance pending further development. Use caution when interpreting data in this category. To promote uniform guidance on the data collection, calculation, and reporting of results, the ACLCA methodology (ACLCA 2019) was used. The environmental impact results of products in this document are based on a declared unit and therefore do not provide sufficient information to establish comparisons. The results shall not be used for comparisons without knowledge of how the physical properties of the product impact the precise function at the construction level. The environmental impact results shall be converted to a functional unit basis before any comparison is attempted. A manufacturer shall not make claims based on an industry-average EPD which leads the market to believe the industry-average is representative of manufacturer-specific or product-specific results.

    Rating systems

    The intent is to reward project teams for selecting products from manufacturers who have verified life-cycle environmental performance.

    LEED BD+C: New Construction | v4 - LEED v4

    Building product disclosure and optimization

    Environmental product declarations

    • Industry-wide (generic) EPD ½ product

    • Product-specific Type III EPD 1 product

    LEED BD+C: New Construction | v4.1 - LEED v4.1

    Building product disclosure and optimization

    Environmental product declarations

    • Industry-wide (generic) EPD 1 product

    • Product-specific Type III EPD 1.5 products

    Green Globes for New Construction and Sustainable Interiors

    Materials and resources

    • NC 3.5.1.2 Path B: Prescriptive Path for Building Core and Shell

    • NC 3.5.2.2 and SI 4.1.2 Path B: Prescriptive Path for Interior Fit-outs

    BREEAM New Construction 2018

    Mat 02 - Environmental impacts from construction products

    Environmental Product Declarations (EPD)

    • Industry-average EPD .5 points

    • Multi-product specific EPD .75 points

    • Product-specific EPD 1 point