EPD additional content CAFCO® 400 Series
Data
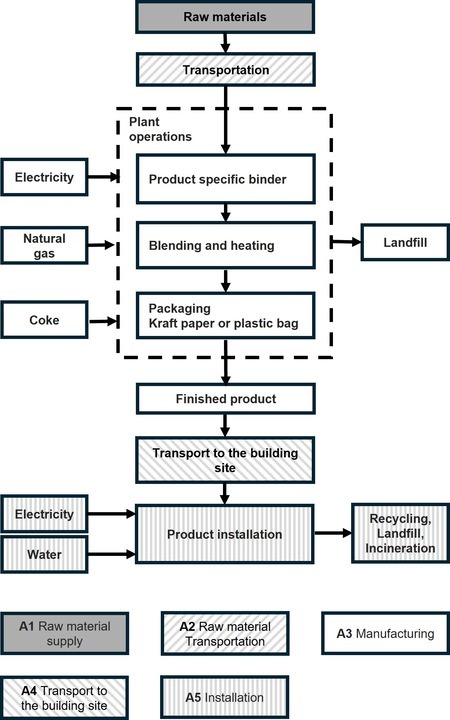
Background This product-specific and facility-specific declaration was created by collecting annual production data. For products manufactured at multiple facilities, primary data was collected separately from each location and modeled individually. All product types are manufactured by blending the specified bulking agent with a number of product-specific binders to achieve prescribed fire rating performance in the field. Finished goods are packaged in individual bags, stacked on pallets, and stretch wrapped before delivery to job sites.
Allocation The model used in this report ensures that the sum of the allocated inputs and outputs of a unit process are equal to the inputs and outputs of the unit process before allocation. This means that no double counting or omissions of inputs or outputs through allocation is occurring. The manufacturing facilities included in this study all produce multiple products. Since only facility level data were available, allocation among a facility’s co-products was necessary to determine the input and output flows associated with each product. Allocation of materials and energy was done on a mass basis for all products. Allocation of transportation was based on the weight of the outputs of products from each facility.
Cut-off criteria for the inclusion of mass and energy flows are 1% of renewable primary resource (energy) usage, 1% nonrenewable primary resource (energy) usage, 1% of the total mass input of that unit process, and 1% of environmental impacts. The total of neglected input flows per module does not exceed 5% of energy usage, mass, and environmental impacts. The only exceptions to these criteria are substances with hazardous and toxic properties, which must be listed even when the given process unit is under the cut-off criterion of 1% of the total mass. No renewable energy was used in production beyond that accounted for in the eGRID data sets for the three facilities, and no energy was recovered. No known flows are deliberately excluded from this declaration, and no substances considered to be hazardous or toxic according to the Toxics Release Inventory (TRI) program or local regulations are present in the products. Biogenic carbon is included in reported results. Therefore, these criteria have been met.
Quality The precision of the data and geographic representativeness are considered to be high. Isolatek personnel provided detailed bills of materials, and facility managers provided utility information for the manufacturing locations. Temporal and technological representativeness are considered to be high. The raw material transportation distances were calculated based on the raw material supplier addresses. The data included is considered complete. The LCA model included all known material and energy flows. The consistency of the model is considered high. The bills of materials provided by Isolatek personnel were developed for multiple internal departments and are maintained regularly.
Background LCI data sets Modeling choices were applied consistently. Except for eGRID electricity data sets, all background LCI data sets used in the study were sourced from ecoinvent v3.11.
Raw material supply [A1]
| Foreground data | Background data set | Reference year | Geography |
| Natural gypsum | Gypsum plasterboard {RoW}| gypsum plasterboard production | Cut-off, U | 2023 | Rest of World (RoW) |
| Plaster of Paris | Gypsum plasterboard {RoW}| gypsum plasterboard production | Cut-off, U | 2023 | Rest of World (RoW) |
| Mica | Expanded vermiculite {RoW}| expanded vermiculite production | Cut-off, U | 2023 | Rest of World (RoW) |
| Vermiculite | Expanded vermiculite {RoW}| expanded vermiculite production | Cut-off, U | 2023 | Rest of World (RoW) |
| Calcium Carbonate | Calcium carbonate, precipitated {RoW}| calcium carbonate production, precipitated | Cut-off, U | 2023 | Rest of World (RoW) |
| Feldspar | Feldspar {RoW}| feldspar production | Cut-off, U | 2023 | Rest of World (RoW) |
| Bentonite Clay | Bentonite {RoW}| bentonite quarry operation | Cut-off, U | 2023 | Rest of World (RoW) |
| Portland Cement Type 1L10 | Cement, Portland {RoW}| cement production, Portland | Cut-off, U | 2023 | Rest of World (RoW) |
| Recycled Cellulose | Empty data set | N/A | N/A |
| Recycled Levy Slag | Blast furnace slag, Recycled Content cut-off GLO | 2023 | Global |
Transport to factory & building site [A2&A4]
| Foreground data | Background data set | Reference year | Geography |
| Bulk tanker | transport, freight, lorry >32 metric ton, EURO4 RoW | 2024 | Rest of World (RoW) |
| Intermodal freight | transport, freight, lorry >32 metric ton, EURO4 RoW | 2024 | Rest of World (RoW) |
| 53’ Dry van | transport, freight, lorry >32 metric ton, EURO4 RoW | 2024 | Rest of World (RoW) |
| 48’ Rail container | Transport, freight train {US}| market for transport, freight train | Cut-off, U | 2024 | The U.S |
Manufacturing [A3]
| Foreground data | Background data set | Reference year | Geography |
| Manufacturing electricity | Electricity mix, eGrid subregion, ERCT/US U | 2023 | The U.S. |
| Manufacturing electricity | Electricity mix, eGrid subregion, CAMX/US U | 2023 | The U.S. |
| Manufacturing electricity | Electricity mix, eGrid subregion, RFCW/US U | 2023 | The U.S. |
| Manufacturing electricity | Electricity mix, eGrid subregion, RFCE/US U | 2023 | The U.S. |
| Natural gas for heat production | market for heat, district or industrial, natural gas RoW | 2024 | Rest of World (RoW) |
| Coke for heat production | Heat, central or small-scale, other than natural gas {RoW}| heat production, hard coal coke, stove 5-15kW | Cut-off, U | 2024 | Rest of World (RoW) |
| Road transport for collecting municipal waste | Municipal waste collection service by 21 metric ton lorry {RoW}| municipal waste collection service by 21 metric ton lorry | Cut-off, U | 2023 | Rest of World (RoW) |
| Landfilled municipal waste | Process-specific burdens, residual material landfill {RoW}| market for process-specific burdens, residual material landfill | Cut-off, U | 2024 | Rest of World (RoW) |
| Waste paper incineration | Waste paperboard {GLO}| treatment of waste paperboard, municipal incineration | Cut-off, U | 2024 | Global |
| Waste paper landfill | Waste paperboard {RoW}| treatment of waste paperboard, sanitary landfill | Cut-off, U | 2024 | Rest of World (RoW) |
| Waste plastic incineration | Waste plastic, mixture {RoW}| treatment of waste plastic, mixture, municipal incineration | Cut-off, U | 2024 | Rest of World (RoW) |
| Waste plastic landfill | Waste plastic, mixture {RoW}| treatment of waste plastic, mixture, sanitary landfill | Cut-off, U | 2024 | Rest of World (RoW) |
| Kraft paper bag | Kraft paper {RoW}| kraft paper production | Cut-off, U | 2023 | Rest of World (RoW) |
| Plastic bag | Packaging film, low density polyethylene {RoW}| production | Conseq, U | 2021 | Rest of World (RoW) |
Installation [A5]
| Foreground data | Background data set | Reference year | Geography |
| Water use | Tap water {RoW}| market for tap water | Cut-off, U | 2024 | Rest of World (RoW) |
| Electricity use | Electricity, medium voltage {US}| market group for electricity, medium voltage | Cut-off, U | 2024 | The U.S |
Scenarios and additional technical information
Manufacturing [A3] The manufacturing process assumes a scrap rate of 2% (20 kg) per declared unit (1,000 kg). Prior to delivery to job sites, the finished goods are individually packaged in kraft paper bags.
| Kraft paper packaging consumption in manufacturing per declared unit | San Bernardino, CA | Stanhope, NJ | Houston, TX |
| CAFCO® 400 - Kraft paper packaging (kg) | 13.73 | 13.79 | 14.03 |
| CAFCO® 400 AC - Kraft paper packaging (kg) | 14.21 | 13.75 | 13.05 |
| Packaging transport and waste treatment scenarios per manufacturing facility | San Bernardino, CA | Stanhope, NJ | Houston, TX |
| Vehicle for packaging transport | 53’ dry van trailers | ||
| Shipping distance for packaging material (km) | 832 | 3,515 | 2,189 |
| Waste disposal | 100% landfill | ||
| Vehicle for waste collection and transport | Garbage truck | ||
| Waste management transport distance (km) | 13 | 43 | 7 |
Transport scenario [A4]
| Name | Value | Unit |
| Fuel type | Diesel | |
| Vehicle type | Truck | |
| Transportation distance | ||
| Transport distance | 500 | km |
| Capacity utilization | 50 | % |
| Capacity utilization volume factor (factor: =1 or <1 or ≥ 1 for compressed or nested packaging products) | 1 | - |
| Gross density | ||
| CAFCO® 400 | 320 | kg/m3 |
| CAFCO® 400 AC | 320 | kg/m3 |
Installation scenario [A5] Kraft paper wastes are generated during product installation as listed per declared unit in the table below
| Product name and facility location | Waste packaging (kg) | Packaging waste disposal assumptions specified by route | Biogenic carbon packaging (kg) |
| CAFCO® 400 San Bernardino, CA |
13.73 | Recycling 8.88 kg; Landfill 3.90 kg; Incineration 0.95 kg |
22.15 |
| CAFCO® 400 Stanhope, NJ |
13.79 | Recycling 8.92 kg; Landfill 3.92 kg; Incineration 0.95 kg |
22.25 |
| CAFCO® 400 Houston, TX |
14.03 | Recycling 9.08 kg; Landfill 3.98 kg; Incineration 0.97 kg |
22.64 |
| CAFCO® 400 AC San Bernardino, CA |
14.21 | Recycling 9.19 kg; Landfill 4.04 kg; Incineration 0.98 kg |
22.93 |
| CAFCO® 400 AC Stanhope, NJ |
13.75 | Recycling 8.90 kg; Landfill 3.91 kg; Incineration 0.95 kg |
22.18 |
| CAFCO® 400 AC Houston, TX |
13.05 | Recycling 8.44 kg; Landfill 3.71 kg; Incineration 0.90 kg |
21.05 |
Disposal [C4] While the impacts from product disposal are out of the scope of this cradle-to-gate with installation study, ISO 21930:2017 requires that biogenic carbon emissions associated with packaging and product disposed be separately reported.
| Product | Facility location | Biogenic carbon emissions associated with disposal [C4] (kg CO2) |
| CAFCO® 400 | San Bernardino, CA | 86.38 |
| CAFCO® 400 | Stanhope, NJ | 1.39 |
| CAFCO® 400 | Houston, TX | 68.27 |
| CAFCO® 400 AC | San Bernardino, CA | 89.17 |
| CAFCO® 400 AC | Stanhope, NJ | 1.39 |
| CAFCO® 400 AC | Houston, TX | 62.7 |
Flow diagram
Technical properties
- MasterSpec®, Section 07 81 00 APPLIED FIREPROOFING (AIA) (C400, C400AC)
- MasterFormat® 2014, Section 07 81 00 Applied Fireproofing (CSC, CSI) (C400, C400AC)
- Unified Facilities Guide Specification, UFGS 07 81 00
- Spray-Applied Fireproofing (USACE, NAVFAC, AFCEC, NASA) (C400, C400AC)
- Master Construction Specifications, 07 81 00
- Applied Fireproofing (VA) (C400, C400AC)
- Code of Federal Regulations, Title 40 Protection of the Environment (EPA) (C400, C400AC)
- PBS-P100, Facilities Standards for the Public Buildings Services (GSA) (C400, C400AC)
- Factory Mutual Approved(C400)
Major assumptions and limitations
- US background data were used whenever possible, with rest-of-world or global data substituted as proxies as necessary.
- 1,000 kg of SFRM is the declared unit in the study, although it should be noted that the studied products are not typically produced to this size.
- LCA results are relative expressions and do not predict impacts on category endpoints, the exceeding of thresholds, safety margins, or risks.
- The EPD owner has sole ownership, liability, and responsibility for the EPD.
Major system boundary exclusions
- Construction of major capital equipment
- Human labor and employee transport
- Disposal of packaging materials associated with final product
- Building operational energy & water use not associated with final product
CAFCO® 400 - San Bernardino, CA: LCI indicator results for resource use, output and waste flows, and carbon emissions & removals per declared unit
Impact category |
Unit |
A1 - Raw Material supply |
A2 - Transport |
A3 - Manufacturing |
A4 - Transport to the Building Site |
A5 - Installation |
Total |
Resource use indicators |
|||||||
RPRE |
MJ, NCV |
1.99E+02 |
2.82E+00 |
5.52E+02 |
1.49E+00 |
8.89E+00 |
7.64E+02 |
RPRM |
MJ, NCV |
8.18E+02 |
0.00E+00 |
7.93E+02 |
0.00E+00 |
0.00E+00 |
1.61E+03 |
RPRtotal |
MJ, NCV |
1.02E+03 |
2.82E+00 |
1.35E+03 |
1.49E+00 |
8.89E+00 |
2.38E+03 |
NRPRE |
MJ, NCV |
3.71E+03 |
1.49E+03 |
9.47E+02 |
7.87E+02 |
8.48E+01 |
7.02E+03 |
NRPRM |
MJ, NCV |
0.00E+00 |
0.00E+00 |
0.00E+00 |
0.00E+00 |
0.00E+00 |
0.00E+00 |
NRPRtotal |
MJ, NCV |
3.71E+03 |
1.49E+03 |
9.47E+02 |
7.87E+02 |
8.48E+01 |
7.02E+03 |
SM |
kg |
6.20E+01 |
0.00E+00 |
0.00E+00 |
0.00E+00 |
0.00E+00 |
6.20E+01 |
RSF |
MJ, NCV |
0.00E+00 |
0.00E+00 |
0.00E+00 |
0.00E+00 |
0.00E+00 |
0.00E+00 |
NRSF |
MJ, NCV |
0.00E+00 |
0.00E+00 |
0.00E+00 |
0.00E+00 |
0.00E+00 |
0.00E+00 |
RE |
MJ, NCV |
0.00E+00 |
0.00E+00 |
0.00E+00 |
0.00E+00 |
0.00E+00 |
0.00E+00 |
FW |
m3 |
2.86E+01 |
1.92E+00 |
6.51E+00 |
1.02E+00 |
1.45E+00 |
3.95E+01 |
ADPfossil |
MJ, NCV |
3.40E+03 |
1.40E+03 |
7.74E+02 |
7.38E+02 |
5.84E+01 |
6.37E+03 |
Output flows and waste category indicators |
|||||||
HWD |
kg |
0.00E+00 |
0.00E+00 |
0.00E+00 |
0.00E+00 |
0.00E+00 |
0.00E+00 |
NHWD |
kg |
0.00E+00 |
0.00E+00 |
2.00E+01 |
0.00E+00 |
1.37E+01 |
3.37E+01 |
HLRW |
kg |
3.70E-04 |
1.92E-05 |
2.93E-04 |
1.02E-05 |
7.11E-05 |
7.63E-04 |
ILLRW |
kg |
8.06E-04 |
4.04E-05 |
6.53E-04 |
2.14E-05 |
2.46E-04 |
1.77E-03 |
CRU |
kg |
0.00E+00 |
0.00E+00 |
0.00E+00 |
0.00E+00 |
0.00E+00 |
0.00E+00 |
MR |
kg |
0.00E+00 |
0.00E+00 |
0.00E+00 |
0.00E+00 |
0.00E+00 |
0.00E+00 |
MER |
kg |
0.00E+00 |
0.00E+00 |
0.00E+00 |
0.00E+00 |
0.00E+00 |
0.00E+00 |
EE |
MJ |
0.00E+00 |
0.00E+00 |
0.00E+00 |
0.00E+00 |
0.00E+00 |
0.00E+00 |
Carbon emissions and removals |
|||||||
BCRP |
kg CO2 |
-8.64E+01 |
0.00E+00 |
0.00E+00 |
0.00E+00 |
0.00E+00 |
-8.64E+01 |
BCEP |
kg CO2 |
0.00E+00 |
0.00E+00 |
0.00E+00 |
0.00E+00 |
0.00E+00 |
0.00E+00 |
BCRK |
kg CO2 |
0.00E+00 |
0.00E+00 |
-2.22E+01 |
0.00E+00 |
0.00E+00 |
-2.22E+01 |
BCEK |
kg CO2 |
0.00E+00 |
0.00E+00 |
0.00E+00 |
0.00E+00 |
2.22E+01 |
2.22E+01 |
CBCEW |
kg CO2 |
0.00E+00 |
0.00E+00 |
0.00E+00 |
0.00E+00 |
0.00E+00 |
0.00E+00 |
CCE |
kg CO2 |
0.00E+00 |
0.00E+00 |
0.00E+00 |
0.00E+00 |
0.00E+00 |
0.00E+00 |
CCR |
kg CO2 |
0.00E+00 |
0.00E+00 |
0.00E+00 |
0.00E+00 |
0.00E+00 |
0.00E+00 |
CWNR |
kg CO2 |
0.00E+00 |
0.00E+00 |
0.00E+00 |
0.00E+00 |
0.00E+00 |
0.00E+00 |
CAFCO® 400 - Stanhope, NJ: LCI indicator results for resource use, output and waste flows, and carbon emissions & removals per declared unit
Impact category |
Unit |
A1 - Raw Material supply |
A2 - Transport |
A3 - Manufacturing |
A4 - Transport to the Building Site |
A5 - Installation |
Total |
Resource use indicators |
|||||||
RPRE |
MJ, NCV |
2.10E+02 |
6.50E-01 |
4.65E+02 |
1.49E+00 |
8.89E+00 |
6.87E+02 |
RPRM |
MJ, NCV |
1.32E+01 |
0.00E+00 |
7.97E+02 |
0.00E+00 |
0.00E+00 |
8.10E+02 |
RPRtotal |
MJ, NCV |
2.23E+02 |
6.50E-01 |
1.26E+03 |
1.49E+00 |
8.89E+00 |
1.50E+03 |
NRPRE |
MJ, NCV |
3.92E+03 |
3.44E+02 |
1.40E+03 |
7.87E+02 |
8.48E+01 |
6.53E+03 |
NRPRM |
MJ, NCV |
0.00E+00 |
0.00E+00 |
0.00E+00 |
0.00E+00 |
0.00E+00 |
0.00E+00 |
NRPRtotal |
MJ, NCV |
3.92E+03 |
3.44E+02 |
1.40E+03 |
7.87E+02 |
8.48E+01 |
6.53E+03 |
SM |
kg |
1.00E+00 |
0.00E+00 |
0.00E+00 |
0.00E+00 |
0.00E+00 |
1.00E+00 |
RSF |
MJ, NCV |
0.00E+00 |
0.00E+00 |
0.00E+00 |
0.00E+00 |
0.00E+00 |
0.00E+00 |
NRSF |
MJ, NCV |
0.00E+00 |
0.00E+00 |
0.00E+00 |
0.00E+00 |
0.00E+00 |
0.00E+00 |
RE |
MJ, NCV |
0.00E+00 |
0.00E+00 |
0.00E+00 |
0.00E+00 |
0.00E+00 |
0.00E+00 |
FW |
m3 |
3.06E+01 |
4.67E-01 |
7.12E+00 |
1.08E+00 |
1.45E+00 |
4.07E+01 |
ADPfossil |
MJ, NCV |
3.59E+03 |
3.23E+02 |
1.01E+03 |
7.38E+02 |
5.84E+01 |
5.72E+03 |
Output flows and waste category indicators |
|||||||
HWD |
kg |
0.00E+00 |
0.00E+00 |
0.00E+00 |
0.00E+00 |
0.00E+00 |
0.00E+00 |
NHWD |
kg |
0.00E+00 |
0.00E+00 |
2.00E+01 |
0.00E+00 |
1.38E+01 |
3.38E+01 |
HLRW |
kg |
3.88E-04 |
4.44E-06 |
8.46E-04 |
1.02E-05 |
7.11E-05 |
1.32E-03 |
ILLRW |
kg |
8.49E-04 |
9.32E-06 |
1.89E-03 |
2.14E-05 |
2.46E-04 |
3.01E-03 |
CRU |
kg |
0.00E+00 |
0.00E+00 |
0.00E+00 |
0.00E+00 |
0.00E+00 |
0.00E+00 |
MR |
kg |
0.00E+00 |
0.00E+00 |
0.00E+00 |
0.00E+00 |
0.00E+00 |
0.00E+00 |
MER |
kg |
0.00E+00 |
0.00E+00 |
0.00E+00 |
0.00E+00 |
0.00E+00 |
0.00E+00 |
EE |
MJ |
0.00E+00 |
0.00E+00 |
0.00E+00 |
0.00E+00 |
0.00E+00 |
0.00E+00 |
Carbon emissions and removals |
|||||||
BCRP |
kg CO2 |
-1.39E+00 |
0.00E+00 |
0.00E+00 |
0.00E+00 |
0.00E+00 |
-1.39E+00 |
BCEP |
kg CO2 |
0.00E+00 |
0.00E+00 |
0.00E+00 |
0.00E+00 |
0.00E+00 |
0.00E+00 |
BCRK |
kg CO2 |
0.00E+00 |
0.00E+00 |
-2.22E+01 |
0.00E+00 |
0.00E+00 |
-2.22E+01 |
BCEK |
kg CO2 |
0.00E+00 |
0.00E+00 |
0.00E+00 |
0.00E+00 |
2.22E+01 |
2.22E+01 |
CBCEW |
kg CO2 |
0.00E+00 |
0.00E+00 |
0.00E+00 |
0.00E+00 |
0.00E+00 |
0.00E+00 |
CCE |
kg CO2 |
0.00E+00 |
0.00E+00 |
0.00E+00 |
0.00E+00 |
0.00E+00 |
0.00E+00 |
CCR |
kg CO2 |
0.00E+00 |
0.00E+00 |
0.00E+00 |
0.00E+00 |
0.00E+00 |
0.00E+00 |
CWNR |
kg CO2 |
0.00E+00 |
0.00E+00 |
0.00E+00 |
0.00E+00 |
0.00E+00 |
0.00E+00 |
CAFCO® 400 - Houston, TX: LCI indicator results for resource use, output and waste flows, and carbon emissions & removals per declared unit
Impact category |
Unit |
A1 - Raw Material supply |
A2 - Transport |
A3 - Manufacturing |
A4 - Transport to the Building Site |
A5 - Installation |
Total |
Resource use indicators |
|||||||
RPRE |
MJ, NCV |
1.97E+02 |
1.75E+00 |
4.99E+02 |
1.49E+00 |
8.89E+00 |
7.08E+02 |
RPRM |
MJ, NCV |
6.46E+02 |
0.00E+00 |
8.10E+02 |
0.00E+00 |
0.00E+00 |
1.46E+03 |
RPRtotal |
MJ, NCV |
8.43E+02 |
1.75E+00 |
1.31E+03 |
1.49E+00 |
8.89E+00 |
2.17E+03 |
NRPRE |
MJ, NCV |
3.75E+03 |
9.29E+02 |
1.13E+03 |
7.87E+02 |
8.49E+01 |
6.68E+03 |
NRPRM |
MJ, NCV |
0.00E+00 |
0.00E+00 |
0.00E+00 |
0.00E+00 |
0.00E+00 |
0.00E+00 |
NRPRtotal |
MJ, NCV |
3.75E+03 |
9.29E+02 |
1.13E+03 |
7.87E+02 |
8.49E+01 |
6.68E+03 |
SM |
kg |
4.90E+01 |
0.00E+00 |
0.00E+00 |
0.00E+00 |
0.00E+00 |
4.90E+01 |
RSF |
MJ, NCV |
0.00E+00 |
0.00E+00 |
0.00E+00 |
0.00E+00 |
0.00E+00 |
0.00E+00 |
NRSF |
MJ, NCV |
0.00E+00 |
0.00E+00 |
0.00E+00 |
0.00E+00 |
0.00E+00 |
0.00E+00 |
RE |
MJ, NCV |
0.00E+00 |
0.00E+00 |
0.00E+00 |
0.00E+00 |
0.00E+00 |
0.00E+00 |
FW |
m3 |
2.91E+01 |
1.16E+00 |
7.07E+00 |
1.01E+00 |
1.45E+00 |
3.98E+01 |
ADPfossil |
MJ, NCV |
3.44E+03 |
8.71E+02 |
9.62E+02 |
7.38E+02 |
5.85E+01 |
6.07E+03 |
Output flows and waste category indicators |
|||||||
HWD |
kg |
0.00E+00 |
0.00E+00 |
0.00E+00 |
0.00E+00 |
0.00E+00 |
0.00E+00 |
NHWD |
kg |
0.00E+00 |
0.00E+00 |
2.00E+01 |
0.00E+00 |
1.40E+01 |
3.40E+01 |
HLRW |
kg |
3.75E-04 |
1.20E-05 |
2.18E-04 |
1.02E-05 |
7.11E-05 |
6.86E-04 |
ILLRW |
kg |
8.15E-04 |
2.50E-05 |
4.88E-04 |
2.14E-05 |
2.46E-04 |
1.60E-03 |
CRU |
kg |
0.00E+00 |
0.00E+00 |
0.00E+00 |
0.00E+00 |
0.00E+00 |
0.00E+00 |
MR |
kg |
0.00E+00 |
0.00E+00 |
0.00E+00 |
0.00E+00 |
0.00E+00 |
0.00E+00 |
MER |
kg |
0.00E+00 |
0.00E+00 |
0.00E+00 |
0.00E+00 |
0.00E+00 |
0.00E+00 |
EE |
MJ |
0.00E+00 |
0.00E+00 |
0.00E+00 |
0.00E+00 |
0.00E+00 |
0.00E+00 |
Carbon emissions and removals |
|||||||
BCRP |
kg CO2 |
-6.83E+01 |
0.00E+00 |
0.00E+00 |
0.00E+00 |
0.00E+00 |
-6.83E+01 |
BCEP |
kg CO2 |
0.00E+00 |
0.00E+00 |
0.00E+00 |
0.00E+00 |
0.00E+00 |
0.00E+00 |
BCRK |
kg CO2 |
0.00E+00 |
0.00E+00 |
-2.26E+01 |
0.00E+00 |
0.00E+00 |
-2.26E+01 |
BCEK |
kg CO2 |
0.00E+00 |
0.00E+00 |
0.00E+00 |
0.00E+00 |
2.26E+01 |
2.26E+01 |
CBCEW |
kg CO2 |
0.00E+00 |
0.00E+00 |
0.00E+00 |
0.00E+00 |
0.00E+00 |
0.00E+00 |
CCE |
kg CO2 |
0.00E+00 |
0.00E+00 |
0.00E+00 |
0.00E+00 |
0.00E+00 |
0.00E+00 |
CCR |
kg CO2 |
0.00E+00 |
0.00E+00 |
0.00E+00 |
0.00E+00 |
0.00E+00 |
0.00E+00 |
CWNR |
kg CO2 |
0.00E+00 |
0.00E+00 |
0.00E+00 |
0.00E+00 |
0.00E+00 |
0.00E+00 |
CAFCO® 400 AC - San Bernardino, CA: LCI indicator results for resource use, output and waste flows, and carbon emissions & removals per declared unit
Impact category |
Unit |
A1 - Raw Material supply |
A2 - Transport |
A3 - Manufacturing |
A4 - Transport to the Building Site |
A5 - Installation |
Total |
Resource use indicators |
|||||||
RPRE |
MJ, NCV |
7.35E+02 |
2.83E+00 |
5.72E+02 |
1.09E+00 |
8.89E+00 |
1.32E+03 |
RPRM |
MJ, NCV |
1.32E+01 |
0.00E+00 |
7.94E+02 |
0.00E+00 |
0.00E+00 |
8.07E+02 |
RPRtotal |
MJ, NCV |
7.49E+02 |
2.83E+00 |
1.37E+03 |
1.09E+00 |
8.89E+00 |
2.13E+03 |
NRPRE |
MJ, NCV |
3.67E+03 |
1.49E+03 |
9.69E+02 |
5.74E+02 |
8.49E+01 |
6.79E+03 |
NRPRM |
MJ, NCV |
0.00E+00 |
0.00E+00 |
0.00E+00 |
0.00E+00 |
0.00E+00 |
0.00E+00 |
NRPRtotal |
MJ, NCV |
3.67E+03 |
1.49E+03 |
9.69E+02 |
5.74E+02 |
8.49E+01 |
6.79E+03 |
SM |
kg |
1.00E+00 |
0.00E+00 |
0.00E+00 |
0.00E+00 |
0.00E+00 |
1.00E+00 |
RSF |
MJ, NCV |
0.00E+00 |
0.00E+00 |
0.00E+00 |
0.00E+00 |
0.00E+00 |
0.00E+00 |
NRSF |
MJ, NCV |
0.00E+00 |
0.00E+00 |
0.00E+00 |
0.00E+00 |
0.00E+00 |
0.00E+00 |
RE |
MJ, NCV |
0.00E+00 |
0.00E+00 |
0.00E+00 |
0.00E+00 |
0.00E+00 |
0.00E+00 |
FW |
m3 |
3.24E+01 |
1.09E+00 |
3.82E+00 |
4.21E-01 |
1.13E+00 |
3.89E+01 |
ADPfossil |
MJ, NCV |
3.26E+03 |
1.40E+03 |
7.91E+02 |
5.39E+02 |
5.85E+01 |
6.05E+03 |
Output flows and waste category indicators |
|||||||
HWD |
kg |
0.00E+00 |
0.00E+00 |
0.00E+00 |
0.00E+00 |
0.00E+00 |
0.00E+00 |
NHWD |
kg |
0.00E+00 |
0.00E+00 |
2.00E+01 |
0.00E+00 |
1.38E+01 |
3.38E+01 |
HLRW |
kg |
7.14E-04 |
1.93E-05 |
3.03E-04 |
7.41E-06 |
7.11E-05 |
1.11E-03 |
ILLRW |
kg |
1.89E-03 |
4.05E-05 |
6.76E-04 |
1.56E-05 |
2.46E-04 |
2.86E-03 |
CRU |
kg |
0.00E+00 |
0.00E+00 |
0.00E+00 |
0.00E+00 |
0.00E+00 |
0.00E+00 |
MR |
kg |
0.00E+00 |
0.00E+00 |
0.00E+00 |
0.00E+00 |
0.00E+00 |
0.00E+00 |
MER |
kg |
0.00E+00 |
0.00E+00 |
0.00E+00 |
0.00E+00 |
0.00E+00 |
0.00E+00 |
EE |
MJ |
0.00E+00 |
0.00E+00 |
0.00E+00 |
0.00E+00 |
0.00E+00 |
0.00E+00 |
Carbon emissions and removals |
|||||||
BCRP |
kg CO2 |
-1.39E+00 |
0.00E+00 |
0.00E+00 |
0.00E+00 |
0.00E+00 |
-1.39E+00 |
BCEP |
kg CO2 |
0.00E+00 |
0.00E+00 |
0.00E+00 |
0.00E+00 |
0.00E+00 |
0.00E+00 |
BCRK |
kg CO2 |
0.00E+00 |
0.00E+00 |
-2.22E+01 |
0.00E+00 |
0.00E+00 |
-2.22E+01 |
BCEK |
kg CO2 |
0.00E+00 |
0.00E+00 |
0.00E+00 |
0.00E+00 |
2.22E+01 |
2.22E+01 |
CBCEW |
kg CO2 |
0.00E+00 |
0.00E+00 |
0.00E+00 |
0.00E+00 |
0.00E+00 |
0.00E+00 |
CCE |
kg CO2 |
0.00E+00 |
0.00E+00 |
0.00E+00 |
0.00E+00 |
0.00E+00 |
0.00E+00 |
CCR |
kg CO2 |
0.00E+00 |
0.00E+00 |
0.00E+00 |
0.00E+00 |
0.00E+00 |
0.00E+00 |
CWNR |
kg CO2 |
0.00E+00 |
0.00E+00 |
0.00E+00 |
0.00E+00 |
0.00E+00 |
0.00E+00 |
CAFCO® 400 AC - Stanhope, NJ: LCI indicator results for resource use, output and waste flows, and carbon emissions & removals per declared unit
Impact category |
Unit |
A1 - Raw Material supply |
A2 - Transport |
A3 - Manufacturing |
A4 - Transport to the Building Site |
A5 - Installation |
Total |
Resource use indicators |
|||||||
RPRE |
MJ, NCV |
7.61E+02 |
7.52E-01 |
4.65E+02 |
1.09E+00 |
8.89E+00 |
1.24E+03 |
RPRM |
MJ, NCV |
8.44E+02 |
0.00E+00 |
8.21E+02 |
0.00E+00 |
0.00E+00 |
1.66E+03 |
RPRtotal |
MJ, NCV |
1.61E+03 |
7.52E-01 |
1.29E+03 |
1.09E+00 |
8.89E+00 |
2.90E+03 |
NRPRE |
MJ, NCV |
3.89E+03 |
3.98E+02 |
1.40E+03 |
5.74E+02 |
8.48E+01 |
6.35E+03 |
NRPRM |
MJ, NCV |
0.00E+00 |
0.00E+00 |
0.00E+00 |
0.00E+00 |
0.00E+00 |
0.00E+00 |
NRPRtotal |
MJ, NCV |
3.89E+03 |
3.98E+02 |
1.40E+03 |
5.74E+02 |
8.48E+01 |
6.35E+03 |
SM |
kg |
6.40E+01 |
0.00E+00 |
0.00E+00 |
0.00E+00 |
0.00E+00 |
6.40E+01 |
RSF |
MJ, NCV |
0.00E+00 |
0.00E+00 |
0.00E+00 |
0.00E+00 |
0.00E+00 |
0.00E+00 |
NRSF |
MJ, NCV |
0.00E+00 |
0.00E+00 |
0.00E+00 |
0.00E+00 |
0.00E+00 |
0.00E+00 |
RE |
MJ, NCV |
0.00E+00 |
0.00E+00 |
0.00E+00 |
0.00E+00 |
0.00E+00 |
0.00E+00 |
FW |
m3 |
3.37E+01 |
2.98E-01 |
4.35E+00 |
4.35E-01 |
1.14E+00 |
4.00E+01 |
ADPfossil |
MJ, NCV |
3.46E+03 |
3.73E+02 |
1.01E+03 |
5.39E+02 |
5.84E+01 |
5.44E+03 |
Output flows and waste category indicators |
|||||||
HWD |
kg |
0.00E+00 |
0.00E+00 |
0.00E+00 |
0.00E+00 |
0.00E+00 |
0.00E+00 |
NHWD |
kg |
0.00E+00 |
0.00E+00 |
2.00E+01 |
0.00E+00 |
1.42E+01 |
3.42E+01 |
HLRW |
kg |
7.45E-04 |
5.13E-06 |
8.46E-04 |
7.41E-06 |
7.11E-05 |
1.67E-03 |
ILLRW |
kg |
1.97E-03 |
1.08E-05 |
1.89E-03 |
1.56E-05 |
2.46E-04 |
4.13E-03 |
CRU |
kg |
0.00E+00 |
0.00E+00 |
0.00E+00 |
0.00E+00 |
0.00E+00 |
0.00E+00 |
MR |
kg |
0.00E+00 |
0.00E+00 |
0.00E+00 |
0.00E+00 |
0.00E+00 |
0.00E+00 |
MER |
kg |
0.00E+00 |
0.00E+00 |
0.00E+00 |
0.00E+00 |
0.00E+00 |
0.00E+00 |
EE |
MJ |
0.00E+00 |
0.00E+00 |
0.00E+00 |
0.00E+00 |
0.00E+00 |
0.00E+00 |
Carbon emissions and removals |
|||||||
BCRP |
kg CO2 |
-8.92E+01 |
0.00E+00 |
0.00E+00 |
0.00E+00 |
0.00E+00 |
-8.92E+01 |
BCEP |
kg CO2 |
0.00E+00 |
0.00E+00 |
0.00E+00 |
0.00E+00 |
0.00E+00 |
0.00E+00 |
BCRK |
kg CO2 |
0.00E+00 |
0.00E+00 |
-2.29E+01 |
0.00E+00 |
0.00E+00 |
-2.29E+01 |
BCEK |
kg CO2 |
0.00E+00 |
0.00E+00 |
0.00E+00 |
0.00E+00 |
2.29E+01 |
2.29E+01 |
CBCEW |
kg CO2 |
0.00E+00 |
0.00E+00 |
0.00E+00 |
0.00E+00 |
0.00E+00 |
0.00E+00 |
CCE |
kg CO2 |
0.00E+00 |
0.00E+00 |
0.00E+00 |
0.00E+00 |
0.00E+00 |
0.00E+00 |
CCR |
kg CO2 |
0.00E+00 |
0.00E+00 |
0.00E+00 |
0.00E+00 |
0.00E+00 |
0.00E+00 |
CWNR |
kg CO2 |
0.00E+00 |
0.00E+00 |
0.00E+00 |
0.00E+00 |
0.00E+00 |
0.00E+00 |
CAFCO® 400 AC - Houston, TX: LCI indicator results for resource use, output and waste flows, and carbon emissions & removals per declared unit
Impact category |
Unit |
A1 - Raw Material supply |
A2 - Transport |
A3 - Manufacturing |
A4 - Transport to the Building Site |
A5 - Installation |
Total |
Resource use indicators |
|||||||
RPRE |
MJ, NCV |
7.61E+02 |
1.52E+00 |
4.67E+02 |
1.09E+00 |
8.88E+00 |
1.24E+03 |
RPRM |
MJ, NCV |
5.93E+02 |
0.00E+00 |
7.54E+02 |
0.00E+00 |
0.00E+00 |
1.35E+03 |
RPRtotal |
MJ, NCV |
1.35E+03 |
1.52E+00 |
1.22E+03 |
1.09E+00 |
8.88E+00 |
2.59E+03 |
NRPRE |
MJ, NCV |
3.75E+03 |
8.08E+02 |
1.10E+03 |
5.74E+02 |
8.48E+01 |
6.31E+03 |
NRPRM |
MJ, NCV |
0.00E+00 |
0.00E+00 |
0.00E+00 |
0.00E+00 |
0.00E+00 |
0.00E+00 |
NRPRtotal |
MJ, NCV |
3.75E+03 |
8.08E+02 |
1.10E+03 |
5.74E+02 |
8.48E+01 |
6.31E+03 |
SM |
kg |
4.50E+01 |
0.00E+00 |
0.00E+00 |
0.00E+00 |
0.00E+00 |
4.50E+01 |
RSF |
MJ, NCV |
0.00E+00 |
0.00E+00 |
0.00E+00 |
0.00E+00 |
0.00E+00 |
0.00E+00 |
NRSF |
MJ, NCV |
0.00E+00 |
0.00E+00 |
0.00E+00 |
0.00E+00 |
0.00E+00 |
0.00E+00 |
RE |
MJ, NCV |
0.00E+00 |
0.00E+00 |
0.00E+00 |
0.00E+00 |
0.00E+00 |
0.00E+00 |
FW |
m3 |
3.37E+01 |
5.89E-01 |
4.11E+00 |
4.35E-01 |
1.14E+00 |
3.99E+01 |
ADPfossil |
MJ, NCV |
3.32E+03 |
7.58E+02 |
9.39E+02 |
5.39E+02 |
5.84E+01 |
5.62E+03 |
Output flows and waste category indicators |
|||||||
HWD |
kg |
0.00E+00 |
0.00E+00 |
0.00E+00 |
0.00E+00 |
0.00E+00 |
0.00E+00 |
NHWD |
kg |
0.00E+00 |
0.00E+00 |
2.00E+01 |
0.00E+00 |
1.31E+01 |
3.31E+01 |
HLRW |
kg |
7.44E-04 |
1.04E-05 |
2.05E-04 |
7.41E-06 |
7.11E-05 |
1.04E-03 |
ILLRW |
kg |
1.97E-03 |
2.18E-05 |
4.60E-04 |
1.56E-05 |
2.46E-04 |
2.71E-03 |
CRU |
kg |
0.00E+00 |
0.00E+00 |
0.00E+00 |
0.00E+00 |
0.00E+00 |
0.00E+00 |
MR |
kg |
0.00E+00 |
0.00E+00 |
0.00E+00 |
0.00E+00 |
0.00E+00 |
0.00E+00 |
MER |
kg |
0.00E+00 |
0.00E+00 |
0.00E+00 |
0.00E+00 |
0.00E+00 |
0.00E+00 |
EE |
MJ |
0.00E+00 |
0.00E+00 |
0.00E+00 |
0.00E+00 |
0.00E+00 |
0.00E+00 |
Carbon emissions and removals |
|||||||
BCRP |
kg CO2 |
-6.27E+01 |
0.00E+00 |
0.00E+00 |
0.00E+00 |
0.00E+00 |
-6.27E+01 |
BCEP |
kg CO2 |
0.00E+00 |
0.00E+00 |
0.00E+00 |
0.00E+00 |
0.00E+00 |
0.00E+00 |
BCRK |
kg CO2 |
0.00E+00 |
0.00E+00 |
-2.11E+01 |
0.00E+00 |
0.00E+00 |
-2.11E+01 |
BCEK |
kg CO2 |
0.00E+00 |
0.00E+00 |
0.00E+00 |
0.00E+00 |
2.11E+01 |
2.11E+01 |
CBCEW |
kg CO2 |
0.00E+00 |
0.00E+00 |
0.00E+00 |
0.00E+00 |
0.00E+00 |
0.00E+00 |
CCE |
kg CO2 |
0.00E+00 |
0.00E+00 |
0.00E+00 |
0.00E+00 |
0.00E+00 |
0.00E+00 |
CCR |
kg CO2 |
0.00E+00 |
0.00E+00 |
0.00E+00 |
0.00E+00 |
0.00E+00 |
0.00E+00 |
CWNR |
kg CO2 |
0.00E+00 |
0.00E+00 |
0.00E+00 |
0.00E+00 |
0.00E+00 |
0.00E+00 |
Acronyms used for resource use, output and waste flows, and carbon emissions & removals
| Indicators | Acronyms used |
| Resource use indicators | |
| Renewable primary energy used as energy carrier (fuel) | RPRE |
| Renewable primary resources with energy content used as material | RPRM |
| Total use of renewable primary resources with energy content | RPRtotal |
| Non-renewable primary resources used as an energy carrier (fuel) | NRPRE |
| Non-renewable primary resources with energy content used as material | NRPRM |
| Total use of non-renewable primary resources with energy content | NRPRtotal |
| Secondary materials | SM |
| Renewable secondary fuels | RSF |
| Non-renewable secondary fuels | NRSF |
| Recovered energy | RE |
| Use of net fresh water resources | FW |
| Abiotic depletion potential for fossil resources | ADPfossil |
| Output flows and waste category indicators | |
| Hazardous waste disposed | HWD |
| Non-hazardous waste disposed | NHWD |
| High-level radioactive waste, conditioned, to final repository | HLRW |
| Intermediate- and low-level radioactive waste, conditioned, to final repository | ILLRW |
| Components for re-use | CRU |
| Materials for recycling | MR |
| Materials for energy recovery | MER |
| Exported energy | EE |
| Carbon emissions and removals | |
| Biogenic Carbon Removal from Product | BCRP |
| Biogenic Carbon Emission from Product | BCEP |
| Biogenic Carbon Removal from Packaging | BCRK |
| Biogenic Carbon Emission from Packaging | BCEK |
| Biogenic Carbon Emission from Combustion of Waste from Renewable Sources Used in Production Processes | BCEW |
| Calcination Carbon Emissions | CCE |
| Carbonation Carbon Removals | CCR |
| Carbon Emissions from Combustion of Waste from Non-Renewable Sources used in Production Processes | CWNR |