LCA & material health results & interpretation Ultramax® MS854114E, MS604114CEFG, & MS604114CUFG
Scope and summary
- Cradle to gate
- Cradle to gate with options
- Cradle to grave
Functional unit
One toilet in an average U.S. residential environment that functions for 20 years. The period of 20 years is an industry accepted average lifespan for residential tanks and their associated components; this is more limited due to changes in consumer preferences and innovations in water usage than the technical lifespan of the product. The vessel is assumed to be replaced at the same time as the tank. The implication is that the LCA model assumes that the application ends at year 20 and that the materials will be treated in an end-of-life scenario.
Reference service life: 20 years
Data Reporting Period: 2017
Default use phase scenario
Eco Ultramax MS854114E and Ultramax II MS604114CEFG: 20 years of service in a U.S. household with 1.28 gallon/use and 5.05 flushes/day and 2.67 people resulting in 125,990 gallons.
Ultramax II 1G MS604114CUFG: 20 years of service in a U.S. household with an average of 1.0 gallon/use and 5.05 flushes/day and 2.67 people resulting in approximately 98,430 gallons.
The toilet bowl is assumed to be cleaned weekly, 52 weeks per year, with 10mL of a 1% sodium lauryl sulfate solution.
What’s causing the greatest impacts
All life cycle stages
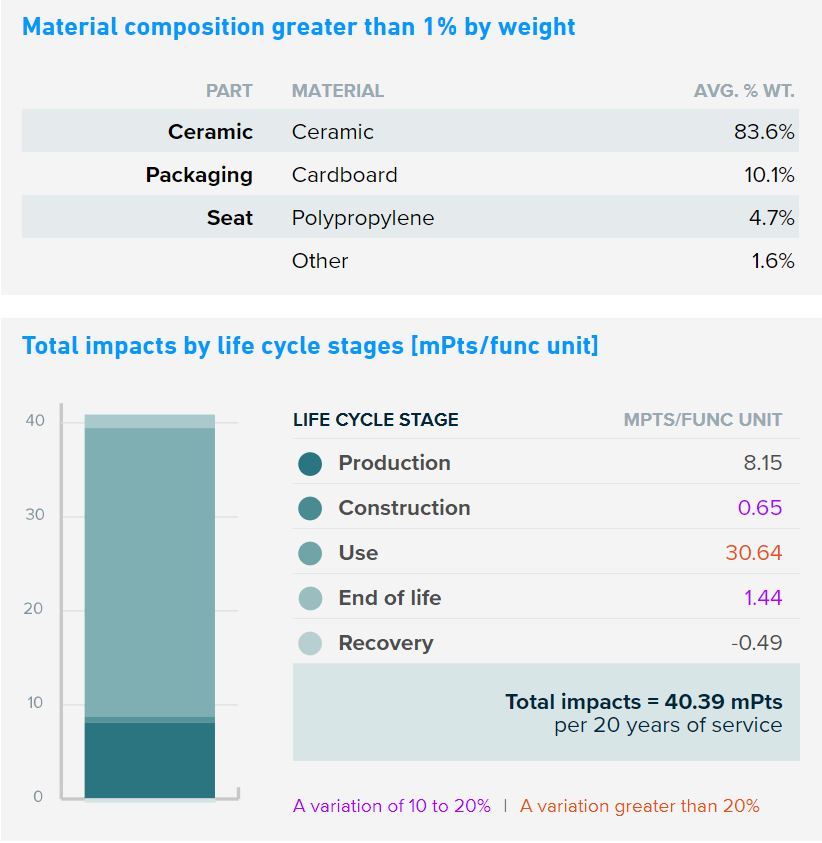
The use stage and the production stage are equally important and dominate the results for all impact categories. The impact of the use stage is mostly due to the embedded energy arising from acquisition, treatment and distribution of the water used during the operation of the product. The production stage has the most significant contributions to fossil fuel depletion (mostly defined by crude oil, hard coal and natural gas extraction activities as well as polypropylene manufacturing), non-carcinogenics (mostly defined by zinc production and processing, the natural gas used at the kiln and the disposal of hard coal ash) and ecotoxicity (mainly caused by electricity production, the disposal of slags and hard coal ash as well as zinc and copper production and processing).
The contributions covered under the construction/installation stage are mostly associated with the product delivery to the market and the disposal of packaging materials, mainly corrugated cardboard. The recovery stage includes recycling processes and benefits by preventing the need to produce primary materials. Recycling is a relevant factor for some of the impact categories, offsetting a portion of the impacts caused by production. Additionally, the delivery of the product to the construction/installation site as well as the processes for dismantling the product and final waste treatment during the end of life stage are slightly relevant in the majority of the impact categories.
Production stage
The ceramic parts dominate the material contribution except for eutrophication and non-carcinogenics. Corrugated board has major contributions to the eutrophication and non-carcinogenics impact categories. The die casting of zinc has a significant contribution to the non-carcinogenic impact category. The injection molding process has a significant contribution to the carcinogenics impact category while the steel parts have a significant contribution to fossil fuel depletion. The remaining parts and processes contribute between 7% and 18% of the overall impacts in the rest of the categories.
Sensitivity analysis
The deviations at the production stage are a combination of the variation in amount of the ceramic component of the two products (10-20% deviation) caused by the differences in the firing yield and production efficiency. Use phase deviations (over 20%) are a result of differences in the product’s water consumption and associated operational energy use. The Ultramax II 1G uses 22% less water than the other two Ultramax versions: The Eco Ultramax and Ultramax II. The deviations at the construction/installation and end of life stages are mainly due to the weight difference of the finished product after packaging, which is driven by the difference in the ceramic component weight in the two products.
Multi-product weighted average
Results represent the weighted average using production volumes for the products covered. Variations of specific products for differences of 10-20% against the average are indicated in purple; differences greater than 20% are indicated in red. A difference greater than 10% is considered significant.
TOTO PeoplePlanetWater™ programs improving environmental performance
- Dual-Max®, E-Max®, Tornado Flush™, 1G®, and EcoPower® reduce water consumption in the use phase
- Energy efficiency programs optimize the firing process
- 50% electricity from renewable energy
- 100% of post-industrial ceramic waste is recycled
LCA results
| Life cycle stage | Production | Construction | Use | End of Life | Recovery |
|
Information modules: Included | Stages D2 and D3 are being excluded Operational energy use is irrelevant to the life cycle of the modeled product. Reuse and energy recovery are not modeled for toilets and/or urinals. |
A1 Raw Materials | A4 Transportation/ Delivery | B1 Use | C1 Deconstruction/ Demolition | D1 Recycling |
| A2 Transportation | A5 Construction/ Installation | B2 Maintenance | C2 Transportation | D2 Recovery | |
| A3 Manufacturing | B3 Repair | C3 Waste processing | D3 Reuse | ||
| B4 Replacement | C4 Disposal | ||||
| B5 Refurbishment | |||||
| B6 Operational energy use | |||||
| B7 Operational water use | |||||
 |
 |
 |
 |
 |
SM Single Score
Learn about SM Single Score results| Impacts per 20 years of service | 8.15 mPts | 0.65 mPts | 30.64 mPts | 1.44 mPts | -0.49 mPts |
| Materials or processes contributing >20% to total impacts in each life cycle stage | Ceramic parts production as well as well zinc and brass parts together with zinc turning process. | Transportation of the product to installation site or consumer and disposal of packaging. | Volume of water use during the operation of the product and the embedded energy use (such as electricity) in the water used. | Transport to waste processing, waste processing and disposal of material flows transported to a landfill. | Plastic and metal components' recycling processes. |
TRACI
- A variation of 10 to 20%
- |
- A variation greater than 20%
| Life cycle stage | Production | Construction | Use | End of Life | Recovery |
Ecological damage
Human health damage
Resources depletion
| Impact category | Unit | |||||
| Fossil fuel depletion | MJ surplus Mega Joule surplus Fossil fuel depletion is the surplus energy to extract minerals and fossil fuels. |
1.95E+02 | 1.17E+01 | 2.75E+02 | 2.18E+00 | -4.82E+00 |
References
LCA Background Report
TOTO Sanitary Ceramic Products LCA Background Report (public version), TOTO 2014
SM Transparency Report Framework
Part A: LCA Calculation Rules and Background Report Requirements (Draft V2) (based on ISO14040-44, ISO14025 and EN15804)
Part B: Product Group Definition – Residential Toilets
"Transparency Reports™ / environmental product declarations enable purchasers and users to compare the potential environmental performance of products on a life cycle basis. They are designed to present information transparently to make the limitations of comparability more understandable. TRs/EPDs of products that conform to the same PCR and include the same life cycle stages, but are made by different manufacturers, may not sufficiently align to support direct comparisons. They therefore, cannot be used as comparative assertions unless the conditions defined in ISO 14025 Section 6.7.2. ‘Requirements for Comparability’ are satisfied." EPDs from different programs (using different PCR) may not be comparable. TRs/EPDs cannot be compared if they do not have the same functional unit, reference service life, and building service life.