LCA & material health results & interpretation Eco Drake® CST744E
Scope and summary
- Cradle to gate
- Cradle to gate with options
- Cradle to grave
Functional unit
One toilet in a U.S. household that functions for 10 years. The period of 10 years is modeled as the period of application based on the average economical lifespan for residential applications. The technical lifespan is longer. The economical lifespan of commercial applications can be longer or lower due to aesthetic replacements or more intense use. The implication is that the LCA model assumes that the application ends at year 10 and that the materials will be treated in an end-of-life scenario.
Reference service life: 10 years
Default use phase scenario
10 years of service in a U.S. household with 1.28 gallon/use and 5.1 flushes/day and 2.6 people resulting in 61,951 gallons.
What’s causing the greatest impacts
All life cycle stages
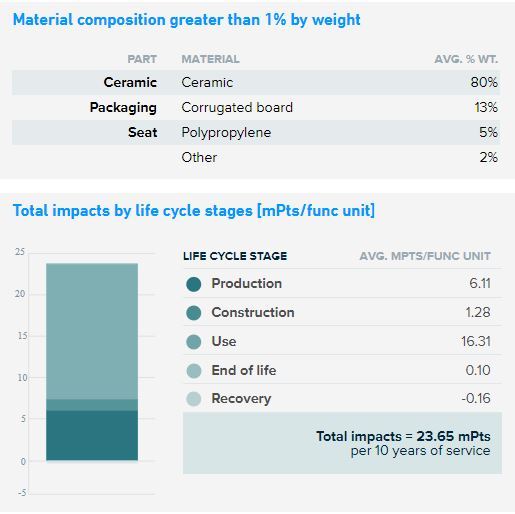
The use stage and the production stage are dominating the results for all impact categories. For the use stage, the significant contribution is mostly due to the embedded energy arising from acquisition, treatment and distribution of the water used during the operation of the product (40-84%). The production stage has a significant contribution to ozone depletion (emissions from natural gas exploration and transportation, crude oil production and the enrichment of uranium in nuclear power plants), fossil fuel depletion (mostly defined by the natural gas at the kiln and its extraction, crude oil production and the production of polypropylene) and non-carcinogens (mostly from the production of zinc and copper and disposal of hard coal ash). The contributions covered under the construction/installation stage are mostly associated with the product delivery to the market. The recovery stage includes recycling benefits by preventing the need to produce primary materials. Recycling is a relevant factor as it has a contribution from 1 to 20% to the impact categories. The end-of-life scenario includes recycling benefits from preventing the need to produce primary materials. It shows up with a non-significant contribution to the results. The end-of-life stage that includes the processes for dismantling and final waste treatment of the product does not have a significant impact.
Production stage
The ceramic parts dominate all impact categories except for non-carcinogenics and eutrophication. The zinc and brass parts together with the brass turning process have significant contributions to the non-carcinogenics and eutrophication impact categories. The remaining parts and processes contribute between 10% and 26% of the overall impacts in the rest of the categories.
Sensitivity analysis
There are no sensitivity results that lead to variations greater than 10% in the LCA results.
TOTO PeoplePlanetWater™ programs improving environmental performance
- Dual-Max®, E-Max®, Tornado Flush™, 1G®, and EcoPower® reduce water consumption in the use phase
- Energy efficiency programs optimize the firing process
- 50% electricity from renewable energy
- 100% of post-industrial ceramic waste is recycled
LCA results
| Life cycle stage | Production | Construction | Use | End of Life | Recovery |
|
Information modules: Included | Stages D2 and D3 are being excluded Operational energy use is irrelevant to the life cycle of the modeled product. Reuse and energy recovery are not modeled for toilets and/or urinals. |
A1 Raw Materials | A4 Transporation/ Delivery | B1 Use | C1 Deconstruction/ Demolition | D1 Recycling |
| A2 Transportation | A5 Construction/ Installation | B2 Maintenance | C2 Transportation | D2 Recovery | |
| A3 Manufacturing | B3 Repair | C3 Waste processing | D3 Reuse | ||
| B4 Replacement | C4 Disposal | ||||
| B5 Refurbishment | |||||
| B6 Operational energy use | |||||
| B7 Operational water use | |||||
 |
 |
 |
 |
 |
SM Single Score
| Impacts per 10 years of service | 7.51 mPts | 0.0889 mPts | 18.2 mPts | 0.062 mPts | -0.0428 mPts |
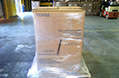
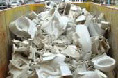
| Materials or processes contributing >20% to total impacts in each life cycle stage | Ceramic parts production as well as well zinc and brass parts together with zinc turning process. | Transportation of the product to installation site or consumer and disposal of packaging. | Volume of water use during the operation of the product and the embedded energy use (such as electricity) in the water used. | Transport to waste processing, waste processing and disposal of material flows transported to a landfill. | Plastic and metal components' recycling processes. |
TRACI
| Life cycle stage | Production | Construction | Use | End of Life | Recovery |
Ecological damage
Human health damage
Additional environmental information
| Impact category | Unit | |||||
| Fossil fuel depletion | MJ surplus Mega Joule, lower heating value Fossil fuel depletion is the surplus energy to extract minerals and fossil fuels. |
1.91E+02 | 2.42E+01 | 1.43E+02 | 2.03E+00 | -3.36E+00 |
References
LCA Background Report
TOTO Sanitary Ceramic Products LCA Background Report (public version), TOTO 2014
SM Transparency Report Framework
Part A: LCA Calculation Rules and Background Report Requirements (Draft V2) (based on ISO14040-44, ISO14025 and EN15804)
Part B: Product Group Definition – Residential Toilets
"Transparency Reports™ / environmental product declarations enable purchasers and users to compare the potential environmental performance of products on a life cycle basis. They are designed to present information transparently to make the limitations of comparability more understandable. TRs/EPDs of products that conform to the same PCR and include the same life cycle stages, but are made by different manufacturers, may not sufficiently align to support direct comparisons. They therefore, cannot be used as comparative assertions unless the conditions defined in ISO 14025 Section 6.7.2. ‘Requirements for Comparability’ are satisfied." EPDs from different programs (using different PCR) may not be comparable. TRs/EPDs cannot be compared if they do not have the same functional unit, reference service life, and building service life.