

LCA results & interpretation Limestone Floor and Pavers
Scope and summary
- Cradle to gate
- Cradle to gate with options
- Cradle to grave
Product description
Limestone flooring can be applied as interior flooring, exterior flooring, landscaping, and terracing. It tends to be durable and easy to maintain, with an elegant outlook. Limestone makes up 100% of the total mass of the flooring and is used in commercial, residential, and public sector buildings.
The results in this study are presented for flooring with a thickness of 0.5 inches.
Functional unit
The functional unit is one square meter of floor covering. The amount of limestone needed to meet the functional unit is 18.20 kg.
Manufacturing data
The data for all limestone products were collected from Polycor's limestone quarries and processing facilities covering a period of two years: January 2020 to December 2021. Data for limestone quarry operations were collected from four quarry sites across North America and two quarries from France and grouped as North American limestone quarries and French quarries. Quarries in France are responsible for 5% of the total quarried stone and all the manufacturing facilities are located in North America.
After limestone is extracted from the quarry, it goes to a processing facility. Stone processor operations data were collected from three Polycor limestone processing sites across North America and grouped together as American limestone plants.
- American limestone plants: three manufacturing facilities in Indiana.
Data were collected from quarries and producers mainly operating in North America (mainly the US). As such, the geographical coverage for this study is based on North American conditions.
Default installation, packaging, and disposal scenarios
Flooring is delivered at the job site ready for installation, where minor cuts may be necessary to accommodate design. Ancillary materials used in the installation of the product include mortar, grout, and acrylate. These materials are structural enhancement components used as bonding agents or fillers for joints. Wood and cardboard used as packaging to safely deliver the stone to the site is then transported to be either landfilled or recycled, following US EPA's end of life scenarios for containers and packaging. At the end of its useful life, the flooring is removed and transported to be landfilled.
About NSI industry-wide EPD results
The NSI industry-wide EPD for natural stone flooring serves as a product group benchmark to which product-specific results can be compared. Three impact categories are used for comparison: global warming potential, respiratory effects, and carcinogenics. Global warming potential was selected because its reductions alone can contribute towards satisfying credits under LEED. Respiratory effects and carcinogenics were selected because they had the greatest reduction in impacts aside from global warming potential.
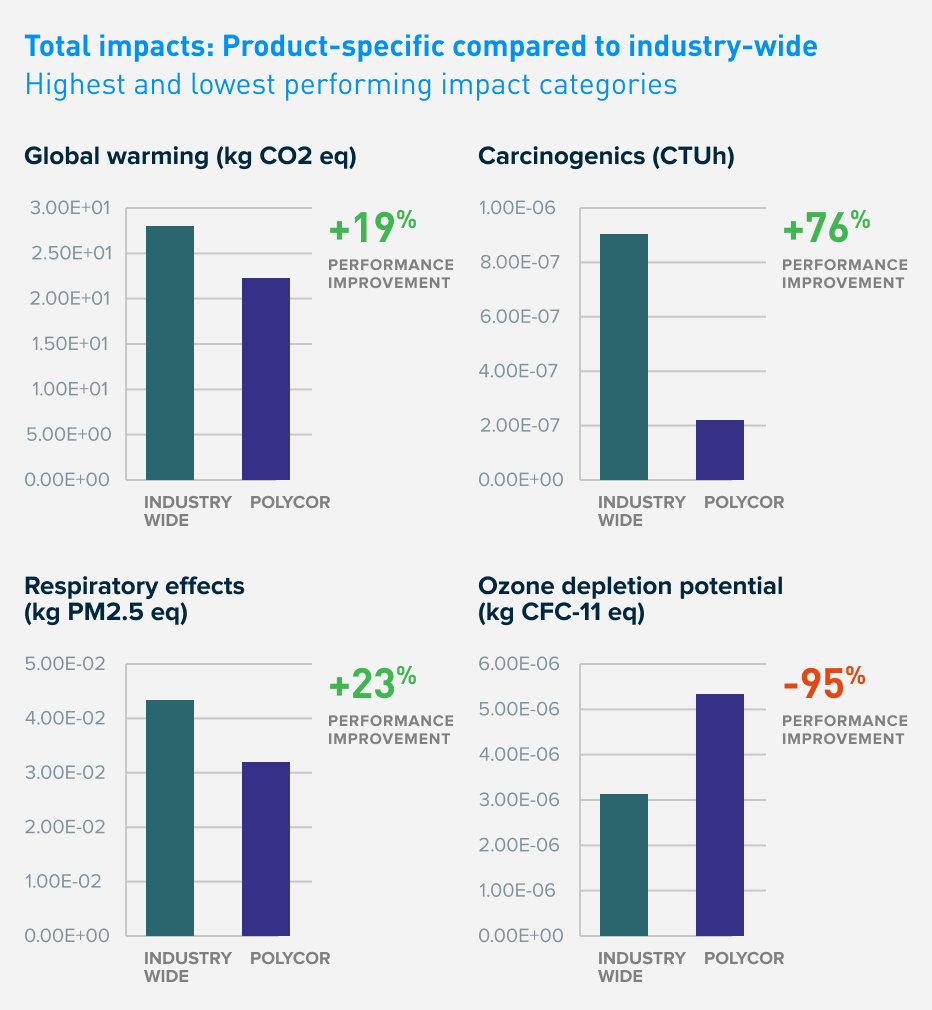
Polycor limestone flooring has better environmental performance in these impact categories than the industry average results but does not represent that the Polycor flooring product is better than any specific manufacturer participating in the industry average.
What’s causing the greatest impacts
All life cycle stages
For limestone flooring, the cradle-to-gate stage (A1-A3) dominates the results for all impact categories except eutrophication and respiratory effects. This study assessed a multitude of inventory and environmental indicators. In addition to the six major impact categories (global warming potential, ozone depletion, acidification, smog, eutrophication, and fossil fuel depletion), additional impact categories have also been included. These six impact categories are globally deemed mature enough to be included in Type III environmental declarations. Other categories are being developed and defined, and LCA should continue making advances in their development. However, the EPD users shall not use additional measures for comparative purposes. LCIA results are relative expressions and do not predict impacts on category endpoints, the exceeding of thresholds, safety margins or risks.
Overall results are consistent with expectations for stone flooring's life cycles, with most of the impacts being generated during cradle-to-gate stages.
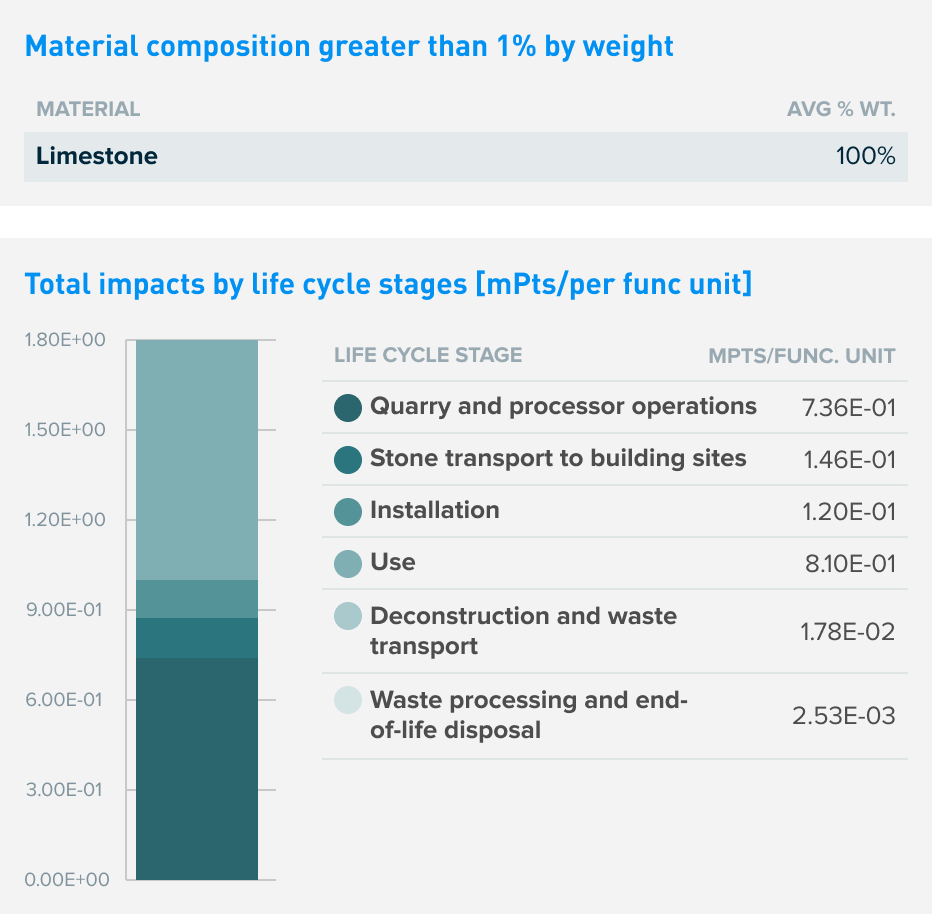
The primary finding, across the environmental indicators, was that cradle-to-gate stage (A1-A3) dominates the impacts due to the energy consumed at the processing plants. The processor operations (A3) stage is the highest contributor to most of the impact categories, followed closely by the maintenance stage. The transportation of stone from quarries to processing plants, transportation of flooring from processing plants to the installation sites, and use of mortar during installation also generate significant impacts in the overall life cycle impacts of limestone flooring.
Quarry operations and transport to processors
Impacts generated at limestone quarries (A1) are mainly due to the use of grid electricity and fuels in the quarries. Other material inputs generate little impact in comparison to the electricity and fuel consumed. The transportation of limestone from quarries to processing plants generates insignificant impacts in overall life cycle impacts.
Processor operations and transport to building sites
Manufacturing operations at limestone processing plants make up the greatest impact share in many of the impact categories. Energy consumed at processors (both electricity and fuels) is responsible for the majority of impacts, while other material inputs have an insignificant contribution. The transportation of limestone flooring manufactured in processor plants to the building sites also has a considerable impact on the overall life cycle impacts of limestone flooring.
Other life cycle stages
Use of sealants for periodic resealing of limestone flooring and use of mortar during installation also generate significant contributions to the overall life cycle impacts. Under normal operating conditions, limestone flooring requires not only monthly cleaning but also resealing every five years. Due to the nature of natural stone, it is anticipated that the limestone flooring products will last for the lifetime of the building. The reference service life (RSL) thus meets an ESL of 75 years, and flooring will need no replacements during its service life. End-of-life stages have lower contributions to the total life cycle impacts.
How our product compares to the industry benchmark
Interpretation summary In November 2022, Natural Stone Institute (NSI) published an industry-wide Type III EPD in which Polycor participated. It followed the SM PCR and SM Part B Benchmarking addendum that enables comparison of a product-specific EPD to the industry benchmark. The SM Part B benchmarking addendum requires the selection of the greatest improvement and lowest performing impact categories.
Polycor limestone flooring LCIA results show environmental performance improvements across all impact categories evaluated in this study except for ozone depletion. The impact reductions primarily stem from A3. Differences in electricity and fuel consumption during fabrication operations contribute significantly when comparing Polycor to industry-average results and identifying the contributors to performance improvement.
The lowest performing impact category (higher impact results than average) is ozone depletion. It is the only category where impacts were greater than the industry average. Since non-granite stone flooring requires re-sealing every five years, it was assumed that a silicone-based sealing for limestone flooring was applied as part of regular maintenance. The addition of the sealer contributed significantly when comparing Polycor to industry-average results. Other natural stone flooring manufacturers may or may not include this as part of their maintenance activities.
Sensitivity analysis
Based on the recommendation provided by Polycor, impacts for processor operations specific to a square meter of limestone flooring was assumed to match the average stone processing for a square meter of limestone. A sensitivity analysis was performed to check the robustness of the results when the energy consumed during processing is varied by +/-20% from the estimate used in this study. The resulting variation in the total life cycle impacts is about 8%, implying that the system is not sensitive to this assumed value.
Another parameter that affects the overall life cycle impacts is the thickness of limestone flooring. The thickness of stone flooring studied varied up to 2 inches. Results have been presented for a typical interior thickness of 0.5 inches, but as the functional mass of varies with the thickness, the impacts also vary. A sensitivity analysis has thus been conducted for various thicknesses of limestone flooring used for different flooring applications. For the thickness of 2 inches and larger, the variation in overall life cycle impacts is greater than 20%, implying that the system is sensitive to thickness value.
How we're making it greener
Natural stone is one of the lowest embodied carbon construction materials. Although we are proud of this intrinsic quality, we want to make sure that we'll never stop improving it. Our main driver is our ambitious 2025 carbon neutrality pledge. By increasing the use of renewable energy, reducing our dependency on fossil fuels, electrifying our car fleet and increasing the energy efficiency throughout our value chain, we aim to reduce our embodied carbon by 40% by the end of 2025!
Beyond embodied carbon, Polycor only uses rainwater for stone extraction, recycles it, and also uses dry sawing technology in a growing number of quarry operations. In quarrying, production, installation and maintenance, natural stone lowers water use throughout its life cycle.
Polycor is the leader within the Natural Stone Sustainability Standard (ANSI 373) with 25% of our sites certified. This standard examines and verifies numerous areas of natural stone production, effectively improving the baseline for the environmental and social performance of natural stone in alignment with green building practices.
LCA results
| Life cycle stage | A1-A3 Production (quarry and processor operations) |
A4 Stone transport to building sites |
A5 Installation |
B1-B7 Use |
C1-C2 Deconstruction and waste transport |
C3-C4 Waste processing and end-of-life disposal |
|
Information modules: Included (X) | Excluded* (MND) |
A1 Quarry operations | A4 Transport to building sites | A5 Installation | B1 Use | C1 Deconstruction | C3 Waste Processing |
| A2 Transport to processors | B2 Maintenance | C2 Waste transport | C4 End of life disposal | |||
| A3 Processor operations | B3 Repair | |||||
| B4 Replacement | ||||||
| B5 Refurbishment | ||||||
| B6 Operational energy use | ||||||
| B6 Operational water use | ||||||
 |
 |
 |
 |
 |
 |
SM Single Score
Learn about SM Single Score results| Impacts of 1 square meter of floor covering | 7.36E-01 mPts | 1.46E-01 mPts | 1.20E-01 mPts | 8.10E-01 mPts | 1.78E-02 mPts | 2.53E-03 mPts |
| Materials or processes contributing >20% to total impacts in each life cycle stage | Energy consumed during stone processing (electricity and fuels). | Truck transportation used to transport product to building site. | Use of ancillary materials (mainly mortar) for installation. | Sealants used for periodic resealing. | Waste transport to the landfill centers. | Landfilling after the end of life. |
TRACI v2.1 results per functional unit
| Life cycle stage | A1-A3 Production (Quarry and Processor operations) |
A4 Stone transport to building sites |
A5 Installation |
B2 Maintenance |
C2 Waste transport |
C4 End-of-life disposal |
Ecological damage
Human health damage
Additional environmental information
| Impact category | Unit | Product | Industry | Product | Industry | Product | Industry | Product | Industry | Product | Industry | Product | Industry |
| Fossil fuel depletion | MJ surplus Mega Joule, lower heating value Fossil fuel depletion is the surplus energy to extract minerals and fossil fuels. |
1.62E+01 | 2.77E+01 | 7.05E+00 | 2.48E+00 | 2.46E+00 | 2.44E+00 | 2.00E+01 | 1.06E+01 | 8.58E-01 | 1.24E+00 | 9.95E-02 | 1.44E-01 |
| Ecotoxicity | CTUe Comparative Toxic Units of Ecotoxicity Ecotoxicity causes negative impacts to ecological receptors and, indirectly, to human receptors through the impacts to the ecosystem. |
45.5 % | 72.7 % | 7.9 % | 2.0 % | 2.4 % | 1.8 % | 43.2 % | 22.4 % | 1.0 % | 1.0 % | 0.0 % | 0.0 % |
References
LCA Background Report
Polycor Natural Stone Flooring LCA Background Report (public version), Polycor 2023. SimaPro Analyst 9.4, ecoinvent 3.4 database.
ISO 21930:2017 serves as the core PCR along with EN 15804 and SM Part A.
SM Part A: Life Cycle Assessment Calculation Rules and Report Requirements, v2018
March, 2018. Document created by Joep Meijer, Naji Kasem, and Kim Lewis and is managed and maintained by the Sustainable Minds Technical Advisory Board (TAB) as outlined in ISO 14025:2006.
SM Part B: Product group definition for Interior and exterior stone flooring, 2022
April, 2022. Part B review conducted by the Sustainable Minds TAB, [email protected]
ISO 14025, “Sustainability in buildings and civil engineering works -- Core rules for environmental product declarations of construction products and services”
Download PDF SM Transparency Report, which includes the additional EPD content required by the SM Part B.
SM Transparency Reports (TR) are ISO 14025 Type III environmental declarations (EPD) that enable purchasers and users to compare the potential environmental performance of products on a life cycle basis. They are designed to present information transparently to make the limitations of comparability more understandable. A limitation to this study is that not all manufacturers in North America participated. TRs/EPDs of products that conform to the same PCR and include the same life cycle stages, but are made by different manufacturers, may not sufficiently align to support direct comparisons. They therefore, cannot be used as comparative assertions unless the conditions defined in ISO 14025 Section 6.7.2. ‘Requirements for Comparability’ are satisfied. Comparison of the environmental performance of building envelope thermal insulation using EPD information shall be based on the product’s use and impacts at the building level, and therefore EPDs may not be used for comparability purposes when not considering the building energy use phase as instructed under the PCR. Full conformance with the PCR for stone flooring allows EPD comparability only when all stages of a life cycle have been considered, when they comply with all referenced standards, use the same sub-category PCR, and use equivalent scenarios with respect to construction works. However, variations and deviations are possible. Example of variations: Different LCA software and background LCI data sets may lead to different results upstream or downstream of the life cycle stages declared.
 SM Transparency Report (EPD)