EPD additional content WASHLET® T1SW2491
Data
Background This product-specific declaration was created by collecting production data from two TOTO production plants, one in Malaysia and another in Thailand. All unit processes were modeled using primary data. Secondary data sources include those available in Ecoinvent v3.10, Industry data 2.0, and US-EI 2.2 databases. Literature data and PCR guidelines were used to fill any data gaps to complete the inventory.
Allocation Since annual resources were reported for the dedicated washlet production line and there are no other co-products, no co-product allocation or allocation of multi-input processes were required. Annual resources provided for the assembly of washlet in each plant were evenly distributed based on the annual production quantity. Allocation of reuse, recycling, and energy recovery is not applicable for this study. The model used in this report ensures that the sum of the allocated inputs and outputs of a unit process is equal to the inputs and outputs of the unit process before allocation.
Cut-off criteria allows the exclusion of mass and energy flows below 1% of renewable and nonrenewable energy use, total mass input, and environmental impacts per unit process, with a maximum of 5%. Hazardous and toxic substances must always be reported, regardless of thresholds. No known flows are deliberately excluded from this declaration, and no substances considered to be hazardous or toxic according to the TRI or local regulations are present in the products. Therefore, these criteria have been met. Biogenic carbon is included in reported results.
Data sets contributing 5% or more to any environmental impact category
| Data set name | Database name & version | Software type & version | Geography | Allocation method |
| Electricity mix 2021/US US-EI U | US-EI 2.2 | SimaPro Analyst 9.6 | United States | By mass |
Treatment, sewage, from residence, to wastewater treatment, class 2/US* US-EI U |
US-EI 2.2 | SimaPro Analyst 9.6 | United States | By mass |
| Printed wiring board, surface mounted, unspecified, Pb free {GLO}| printed wiring board production, surface mounted, unspecified, Pb free | Ecoinvent v3.10 | SimaPro Analyst 9.6 | Global | By mass |
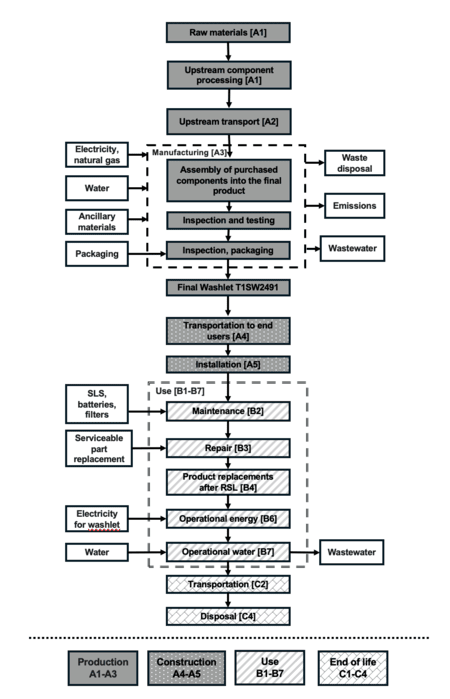
Flow diagram
Scenarios and additional technical information
Distribution [A4]
| Transportation leg | Mode | TOTO Thailand | TOTO Malaysia | Weighted | Unit |
| Manufacturing plants to TOTO distribution centers) | Road transport in manufacturing country | 105.8 | 94.9 | 99.4 | km |
| Sea transport to US | 7927 | 7817 | 7862 | km | |
| Rail transport to TOTO centers | 2190.9 | km | |||
| Transport to final users | Road transport to Costco outlets | 1744.9 | km | ||
| Passenger pick-up | 50 | km | |||
Installation [A5]
Packaging waste from installation is assumed to be transported 100km to recycling (80.9%), landfill (15.4%), or incineration (3.7%).
End of life [C1-C4]
The model assumes that the electronic bidet seat is 100% landfilled at the end of its life. The product is assumed to be transported 100 km via truck to landfill centers.
Product information
- Meets and exceeds: ASME A112.4.2, ASME A112.18.1/CSA B125.1, UL1431, CSA C22.2#68
- Code compliance with UPC, IPC, NSPC, NPC Canada, and others
Major assumptions and limitations
- Assumptions for upstream processing operations regarding each purchased component were developed via suggestions from TOTO personnel and suppliers.
- It was assumed that the same manufacturing resources were consumed for the assembly of washlet in both TOTO facilities.
- Generic data sets used for material inputs, transportation, and waste processing are considered good quality, but actual impacts from material suppliers, transport carriers, and local waste processing may vary.
- Available ecoinvent data sets were manually updated to represent the upstream component production in the supplier country. However, actual manufacturing operations and resources consumed for each component may vary.
- Manufacturing yield has been considered for each upstream component production based on TOTO’s internal discussions and outreach with suppliers, but actual material losses during production of components vary.
Major system boundary exclusions
- Construction of major capital equipment
- Construction of water and wastewater infrastructure
- Maintenance and operation of support equipment
- Human labor and employee transport
- Manufacture and transport of packaging not associated with final product
- Energy consumption in warehouses, distribution centers, and retail facilities during the course of transport to the final customer
Data quality assessment
Precision: The precision of the data is considered high. Product engineers provided detailed bills of materials, and facility managers provided utility information for the manufacturing facilities. The primary information for upstream and downstream transportation distances were also provided.
Completeness: The data included is considered complete. The LCA model included all known material and energy flows. Besides capital equipment, no data was knowingly omitted.
Consistency: The consistency of the model is considered high. The bills of materials provided by the product engineers were developed for multiple internal departments use and are maintained regularly. The LCA practitioner also cross-referenced the installation documents and other relevant information to ensure consistency.
LCIA results, resource use, output and waste flows, and carbon emissions & removals per functional unit
| Parameters | A1-A3 | A4 | A5 | B1, B5 | B2 | B3 | B4 | B6 | B7 | C1, C3 | C2 | C4 | Total |
| LCIA results | |||||||||||||
| Ozone depletion (kg CFC-11 eq) | 1.14E-05 | 2.74E-07 | 6.42E-09 | 0 | 5.90E-08 | 8.51E-07 | 4.66E-05 | 5.13E-05 | 1.17E-06 | 0 | 1.07E-08 |
1.74E-09 | 1.12E-04 |
| Global warming (kg CO2 eq) | 1.12E+02 | 1.46E+01 | 8.98E-01 | 0 | 3.70E+00 | 3.33E-01 | 5.18E+02 | 1.24E+03 | 2.00E+01 | 0 | 6.48E-01 | 9.94E-01 | 1.94E+03 |
| Smog (kg O3 eq) | 8.20E+00 | 9.62E-01 |
5.81E-02 | 0 | 8.04E-01 | 1.48E+00 | 3.73E+01 | 4.09E+01 | 1.25E-01 | 0 | 9.73E-02 | 1.02E-02 | 9.10E+01 |
| Acidification (kg SO2 eq) | 7.99E-01 | 5.07E-02 | 1.97E-03 | 0 | 2.96E-02 | 1.14E-01 | 3.42E+00 | 4.86E+00 | 1.25E-01 | 0 | 3.16E-03 | 5.08E-04 | 9.40E+00 |
| Eutrophication (kg N eq) | 1.99E-01 | 2.43E-03 | 7.50E-04 |
0 | 2.72E-02 | 1.37E-02 | 8.16E-01 | 3.96E-01 | 7.41E-01 | 0 | 2.00E-04 | 1.66E-03 | 2.20E+00 |
| Respiratory effects (kg PM2.5 eq) | 1.36E-01 | 4.55E-03 | 2.43E-04 | 0 | 5.78E-03 | 2.21E-02 | 5.66E-01 | 2.85E-01 | 6.49E-03 | 0 | 3.95E-04 | 7.86E-05 | 1.03E+00 |
| Additional environmental information | |||||||||||||
| Carcinogenics (CTUh) | 1.51E-06 | 6.37E-09 | 6.64E-10 | 0 | 4.15E-07 | 8.82E-08 | 6.07E-06 | 2.35E-06 | 1.97E-06 | 0 | 1.39E-10 | 1.80E-09 | 1.24E-05 |
| Non-carcinogenics (CTUh) | 4.65E-05 | 6.52E-07 | 3.95E-08 | 0 | 3.48E-06 | 1.31E-06 | 1.89E-04 | 3.83E-05 | 4.01E-05 | 0 | 2.86E-08 | 1.22E-07 | 3.20E-04 |
| Ecotoxicity (CTUe) | 2.57E+02 | 1.21E+01 | 1.90E-01 | 0 | 7.78E+01 | 2.36E+01 | 1.08E+03 | 9.27E+01 | 9.42E+01 | 0 | 8.36E-02 | 9.19E-01 | 1.64E+03 |
| Fossil fuel depletion (MJ surplus) | 1.49E+02 | 2.62E+01 | 7.21E-01 | 0 | 3.16E+00 | 3.16E+00 | 7.10E+01 | 1.58E+03 | 2.30E+01 |
0 | 1.21E+00 | 1.82E-01 | 2.58E+03 |
| Resource use indicators | |||||||||||||
| Renewable primary energy used as energy carrier (fuel) (MJ, LHV) | 2.05E+02 | 6.74E-01 | 1.52E-02 | 0 | 7.03E+01 | 2.32E+01 | 8.22E+02 | 1.85E+03 | 3.25E+01 | 0 | 1.61E-02 | 3.44E-02 | 3.00E+03 |
| Renewable primary resources with energy content used as material (MJ, LHV) | 7.50E+00 | 0 | 0 | 0 | 0 | 0 | 3.00E+01 | 0 | 0 | 0 | 0 | 0 | 3.75E+01 |
| Total use of renewable primary resources with energy content (MJ, LHV) | 2.12E+02 | 6.74E-01 | 1.52E-02 | 0 | 7.03E+01 | 2.32E+01 | 8.52E+02 | 1.85E+03 | 3.25E+01 | 0 | 1.61E-02 | 3.44E-02 | 3.04E+03 |
| Non-renewable primary resources used as an energy carrier (fuel) (MJ, LHV) | 1.54E+03 | 1.86E+02 | 5.06E+00 | 0 | 3.43E+01 | 4.88E+02 | 6.96E+03 | 2.22E+04 | 3.19E+02 | 0 | 8.48E+00 | 1.45E+00 | 3.17E+04 |
| Non-renewable primary resources with energy content used as material (MJ, LHV) | 1.31E+02 | 0 | 0 | 0 | 1.19E+00 | 2.11E+02 | 5.25E+02 | 0 | 0 | 0 | 0 | 0 | 8.68E+02 |
| Total use of non-renewable primary resources with energy content (MJ, LHV) | 1.67E+03 | 1.86E+02 | 5.06E+00 | 0 | 3.55E+01 | 6.99E+02 | 7.48E+03 | 2.22E+04 | 3.19E+02 | 0 | 8.48E+00 | 1.45E+00 | 3.26E+04 |
| Secondary materials (kg) | 0 | 0 | 0 | 0 | 0 | 0 | 0 | 0 | 0 | 0 | 0 | 0 | 0 |
| Renewable secondary fuels (MJ, LHV) | 0 | 0 | 0 | 0 | 0 | 0 | 0 | 0 | 0 | 0 | 0 | 0 | 0 |
| Non-renewable secondary fuels (MJ, LHV) | 0 | 0 | 0 | 0 | 0 | 0 | 0 | 0 | 0 | 0 | 0 | 0 | 0 |
| Recovered energy (MJ, LHV) | 0 | 0 | 0 | 0 | 0 | 0 | 0 | 0 | 0 | 0 | 0 | 0 | 0 |
| Use of net fresh water resources (m3) | 6.08E+02 | 2.45E+00 | 7.43E-02 | 0 | 2.15E+01 | 9.99E+01 | 2.44E+03 | 2.65E+01 | 2.90E+01 | 0 | 7.10E-02 | 1.97E-01 | 3.23E+03 |
| Abiotic depletion potential, fossil (MJ, LHV) | 1.52E+03 | 1.85E+02 | 5.04E+00 | 0 | 3.27E+01 | 6.74E+02 | 6.89E+03 | 2.22E+02 | 2.22E+02 | 0 | 8.46E+00 | 1.40E+00 | 2.49E+04 |
| Output flows and waste category indicators | |||||||||||||
| Hazardous waste disposed (kg) | 6.79E-04 | 0 | 0 | 0 | 0 | 0 | 2.72E-03 | 0 | 0 | 0 | 0 | 0 | 3.39E-03 |
| Non-hazardous waste disposed (kg) | 7.58E-05 | 0 | 4.98E-01 | 0 | 3.08E-01 | 5.90E+00 | 2.16E+01 | 0 | 0 | 0 | 0 | 4.90E+00 | 3.32E+01 |
| High-level radioactive waste, conditioned, to final repository (kg) | 6.73E-04 | 3.88E-06 | 1.02E-07 | 0 | 1.34E-04 | 1.08E-04 | 2.71E-03 | 2.01E-02 | 2.87E-04 | 0 | 1.15E-07 | 2.13E-07 | 2.39E-02 |
| Intermediate- and low-level radioactive waste, conditioned, to final repository (kg) | 2.12E-03 | 1.14E-05 | 2.41E-07 | 0 | 2.90E-05 | 2.51E-04 | 8.51E-03 | 4.47E-02 | 6.39E-04 | 0 | 2.65E-07 | 5.36E-07 | 5.63E-02 |
| Components for re-use (kg) | 0 | 0 | 0 | 0 | 0 | 0 | 0 | 0 | 0 | 0 | 0 | 0 | 0 |
| Materials for recycling (kg) | 0 | 0 | 2.20E+00 | 0 | 0 | 0 | 8.80E+00 | 0 | 0 | 0 | 0 | 0 | 1.10E+01 |
| Materials for energy recovery (kg) | 0 | 0 | 1.21E-02 | 0 | 0 | 0 | 4.86E-01 | 0 | 0 | 0 | 0 | 00 | 6.07E-01 |
| Exported energy (MJ, LHV) | 0 | 0 | 0 | 0 | 0 | 0 | 0 | 0 | 0 | 0 | 0 | 0 | 0 |
| Carbon emissions and removals | |||||||||||||
| Biogenic Carbon Removal from Product (kg CO2) | 0 | 0 | 0 | 0 | 0 | 0 | 0 | 0 | 0 | 0 | 0 | 0 | 0 |
| Biogenic Carbon Emission from Product (kg CO2) | 0 | 0 | 0 | 0 | 0 | 0 | 0 | 0 | 0 | 0 | 0 | 0 | 0 |
| Biogenic Carbon Removal from Packaging (kg CO2) | 5.92E+00 | 0 | 0 | 0 | 0 | 0 | 2.37E+01 | 0 | 0 | 0 | 0 | 0 | 2.96E+01 |
| Biogenic Carbon Emission from Packaging (kg CO2) | 0 | 0 | 4.95E+00 | 0 | 0 | 0 | 2.37E+01 | 0 | 0 | 0 | 0 | 9.74E-01 | 2.96E+01 |
| Biogenic Carbon Emission from Combustion of Waste from Renewable Sources Used in Production Processes (kg CO2) | 0 | 0 | 0 | 0 | 0 | 0 | 0 | 0 | 0 | 0 | 0 | 0 | 0 |
| Calcination Carbon Emissions (kg CO2) | 0 | 0 | 0 | 0 | 0 | 0 | 0 | 0 | 0 | 0 | 0 | 0 | 0 |
| Carbonation Carbon Removals (kg CO2) | 0 | 0 | 0 | 0 | 0 | 0 | 0 | 0 | 0 | 0 | 0 | 0 | 0 |
| Carbon Emissions from Combustion of Waste from Renewable and Non-Renewable Sources used in Production Processes (kg CO2) | 0 | 0 | 0 | 0 | 0 | 0 | 0 | 0 | 0 | 0 | 0 | 0 | 0 |