EPD additional content Wall and Ceiling Liner & Atmosphere™ Duct Liner
Data
Background This product-specific plant-specific declaration was created by collecting production data from the Shelbyville, IN production locations. Secondary data sources include those available in LCA for Experts 2023 databases.
Allocation The PCR prescribes where and how allocation occurs. Since only facility-level data were available, allocation among the facilities' other co-products was necessary to determine the input and output flows associated with the product. Allocation of batch materials and energy was done on a product output mass basis, binder materials were allocated based on the mass calculated from the bill of materials and binder formulations, facers were allocated based on product area, and packaging was allocated based on mass per package of product. Allocation of transportation was based on either weight or volume, depending on which was found to restrict the amount of cargo; the limiting factor was used in allocating transportation.
Cut-off criteria for the inclusion of mass and energy flows are 1% of renewable primary resource (energy) usage, 1% nonrenewable primary resource (energy) usage, 1% of the total mass input of that unit process, and 1% of environmental impacts. The total of neglected input flows per module does not exceed 5% of energy usage, mass, and environmental impacts. The only exceptions to these criteria are substances with hazardous and toxic properties, which must be listed even when the given process unit is under the cut-off criterion of 1% of the total mass. No known flows are deliberately excluded from this declaration; therefore, these criteria have been met. Biogenic carbon is included in reported results.
Quality Temporal and technological representativeness are considered to be high. Geographical representativeness is considered to be high. All relevant process steps for the product system were considered and modeled. The process chain is considered sufficiently complete with regards to the goal and scope of this study. The product system was checked for mass balance and completeness of the inventory. Capital goods were excluded since they are assumed not to significantly affect the conclusions of the LCA. Otherwise, no data were knowingly omitted. For more information on data quality, see the LCA background report.
LCIA impact factors required by the PCR are global warming, ozone depletion, acidification, eutrophication, smog, and fossil fuel depletion; “These six impact categories are globally deemed mature enough to be included in Type III environmental declarations. Other categories are being developed and defined and LCA should continue making advances in their development. However, the EPD users shall not use additional measures for comparative purposes.”
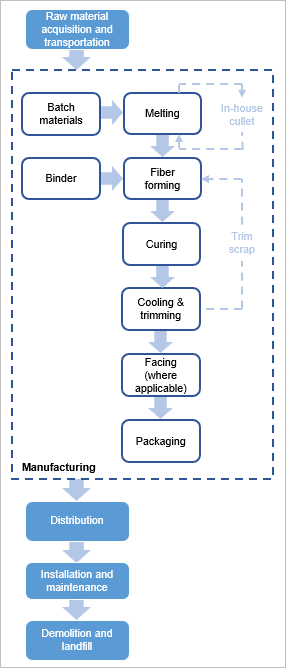
Flow diagram
Scenarios and additional technical information
| PARAMETER | VALUE | UNIT |
| Transport to the building site [A4] | ||
| Vehicle type | Truck and trailer | - |
| Fuel type | Diesel | - |
| Average distance from manufacturing to installation site | 161 | km |
| Capacity utilization | 27 | % |
| Gross density | 24.0 | kg/m³ |
| Capacity utilization volume factor | 1 | - |
| Installation into the building [A5] | ||
| Wall and Ceiling Liner | ||
| Mass of plastic packaging waste | 0.00887 | kg |
| Biogenic carbon content of packaging | 0.0198 | kg CO₂ |
| Atmosphere™ Duct Liner | ||
| Mass of plastic packaging waste |
0.0168 |
kg |
| Biogenic carbon content of packaging |
0.0234 | kg CO₂ |
End of life [C1-C4] |
||
Assumptions for scenario development |
Following manual removal of the insulation, it was assumed to be transported 100 miles to disposal. The PCR prescribes that 100% of the insulation is sent to landfill, where no prior waste processing is required. |
|
Wall and Ceiling Liner |
||
Collection process |
Collected with mixed construction waste |
0.971 kg |
Disposal |
Product for final deposition in landfill |
0.971 kg |
Atmosphere™ Duct Liner |
||
Collection process |
Collected with mixed construction waste |
1.04 kg |
Disposal |
Product for final deposition in landfill |
1.04 kg |
Technical properties |
|
Wall and Ceiling Liner |
|
Dimensions/quantities delivered to installation site |
Wall and Ceiling Liner is sold in rolls. One master bag contains 4 plastic bags, and each bag contains 1 roll of the product. The dimensions for the product are 1” – 2” thick, 48" in width, and 50' – 100’ in length. |
ASTM or ANSI product specification |
ASTM C1071; Type I |
Corrosiveness |
ASTM C665; Does not accelerate corrosion on steel |
Corrosion |
ASTM C1617; Pass |
Surface burning characteristics (flame spread/smoke developed) |
ASTM E84, UL 723, NFPA 90A and 90B (IB), CAN/ULC S102 (IB); 25/50 |
Atmosphere™ Duct Liner |
|
Dimensions/quantities delivered to installation site |
Atmosphere™ Duct Liner is sold in rolls. One master bag contains 4 plastic bags, and each bag contains 1 roll of the product. The dimensions for the product are 1” – 2” thick, 48" – 59” in width, and 50' – 100’ in length. |
ASTM or ANSI product specification |
ASTM C1071; Type I |
Corrosiveness |
ASTM C665; Does not accelerate corrosion on steel |
Corrosion |
ASTM C1617; Pass |
Water Vapor Sorption (by weight) |
ASTM C1104; Less than 3% |
Mold Growth |
ASTM C1338, UL 2824, ASTM G21, ASTM G22; Pass |
Surface burning characteristics (flame spread/smoke developed) |
ASTM E84, UL 723, NFPA 90A and 90B (IB), CAN/ULC S102 (IB); 25/50 |
Major system boundary exclusions
- Capital goods and infrastructure; maintenance of operation and support equipment;
- Manufacture & transport of packaging materials not associated with final product;
- Human labor and employee transport;
- Building operational energy and water use not associated with final product.
Major assumptions and limitations
- Due to the nature of fiberglass insulation, it is anticipated that it will last for the lifetime of the building, so the reference service life (RSL) is considered to be the same as the building estimated service life (ESL) of 75 years.
- Generic data sets used for material inputs, transport, and waste processing are considered good quality, but actual impacts from material suppliers, transport carriers, and local waste processing may vary.
- The impact assessment methodology categories do not represent all possible environmental impact categories.
- Characterization factors used within the impact assessment methodology may contain varying levels of uncertainty.
- LCA results are relative expressions and do not predict impacts on category endpoints, the exceeding of thresholds, safety margins or risks.
Wall and Ceiling Liner produced in Shelbyville, IN: LCIA results, resource use, output and waste flows, and carbon emissions & removals per functional unit
| Parameter | Unit | A1-A3 | A4 | A5 | B1-B7 | C1 | C2 | C3 | C4 | Total |
| LCIA results | ||||||||||
| Global warming | kg CO₂ eq | 2.80E+00 | 2.91E-02 | 1.44E-02 | 0 | 0 | 1.56E-02 | 0 | 2.03E-02 | 2.88E+00 |
| Ozone depletion | kg CFC-11 eq | 5.85E-12 | 6.50E-17 | 5.73E-17 | 0 | 0 | 3.48E-17 | 0 | 9.98E-16 | 5.85E-12 |
| Acidification | kg SO₂ eq | 9.09E-03 | 1.49E-04 | 3.06E-05 | 0 | 0 | 4.26E-05 | 0 | 1.08E-04 | 9.42E-03 |
| Eutrophication | kg N eq | 1.27E-03 | 1.28E-05 | 5.89E-06 | 0 | 0 | 4.52E-06 | 0 | 4.72E-06 | 1.30E-03 |
| Smog | kg O₃ eq | 1.01E-01 | 5.13E-03 | 1.52E-04 | 0 | 0 | 9.73E-04 | 0 | 1.96E-03 | 1.10E-01 |
| Respiratory effects | kg PM2.5 eq | 5.22E-04 | 7.31E-06 | 7.49E-07 | 0 | 0 | 1.83E-06 | 0 | 8.31E-06 | 5.40E-04 |
| Additional environmental information | ||||||||||
| Carcinogenics | CTUh | 98.3% | 0.1% | 0.0% | 0.0% | 0.0% | 0.1% | 0.0% | 1.5% | 100% |
| Non-carcinogenics | CTUh | 97.9% | 0.1% | 0.1% | 0.0% | 0.0% | 0.1% | 0.0% | 1.8% | 100% |
| Ecotoxicity | CTUe | 98.3% | 0.8% | 0.0% | 0.0% | 0.0% | 0.4% | 0.0% | 0.4% | 100% |
| Fossil fuel depletion | MJ surplus | 5.97E+00 | 5.46E-02 | 1.87E-03 | 0 | 0 | 2.92E-02 | 0 | 4.09E-02 | 6.09E+00 |
| Resource use indicators | ||||||||||
| Renewable primary energy used as energy carrier (fuel) | MJ, LHV | 9.12E+00 | 1.61E-02 | 2.34E-03 | 0 | 0 | 8.59E-03 | 0 | 3.80E-02 | 9.18E+00 |
| Renewable primary resources with energy content used as material | MJ, LHV | 8.84E-06 | -1.33E-12 | 5.08E-13 | 0 | 0 | -7.11E-13 | 0 | 7.58E-12 | 8.84E-06 |
| Non-renewable primary resources used as an energy carrier (fuel) | MJ, LHV | 5.50E+01 | 4.13E-01 | 1.79E-02 | 0 | 0 | 2.21E-01 | 0 | 3.25E-01 | 5.60E+01 |
| Non-renewable primary resources with energy content used as material | MJ, LHV | 2.22E-07 | 1.64E-09 | 4.74E-11 | 0 | 0 | 8.79E-10 | 0 | 8.10E-10 | 2.26E-07 |
| Secondary materials | kg | 2.32E-01 | 0.00E+00 | 0.00E+00 | 0 | 0 | 0.00E+00 | 0 | 0.00E+00 | 2.32E-01 |
| Renewable secondary fuels | MJ, LHV | 0.00E+00 | 0.00E+00 | 0.00E+00 | 0 | 0 | 0.00E+00 | 0 | 0.00E+00 | 0.00E+00 |
| Non-renewable secondary fuels | MJ, LHV | 0.00E+00 | 0.00E+00 | 0.00E+00 | 0 | 0 | 0.00E+00 | 0 | 0.00E+00 | 0.00E+00 |
| Recovered energy | MJ, LHV | 0.00E+00 | 0.00E+00 | 0.00E+00 | 0 | 0 | 0.00E+00 | 0 | 0.00E+00 | 0.00E+00 |
| Use of net fresh water resources | m³ |
3.78E-01 | 5.58E-05 | 1.33E-05 | 0 | 0 | 2.99E-05 | 0 | 4.03E-05 | 3.78E-01 |
| Abiotic depletion potential, fossil | MJ, LHV | 4.83E+01 | 4.10E-01 | 1.60E-02 | 0 | 0 | 2.19E-01 | 0 | 3.15E-01 | 4.92E+01 |
| Output flows and waste category indicators | ||||||||||
| Hazardous waste disposed | kg | 0.00E+00 | 0.00E+00 | 0.00E+00 | 0 | 0 | 0.00E+00 | 0 | 0.00E+00 | 0.00E+00 |
| Non-hazardous waste disposed | kg | 1.37E-01 | 0.00E+00 | 4.82E-02 | 0 | 0 | 0.00E+00 | 0 | 8.69E-01 | 1.05E+00 |
| High-level radioactive waste | kg | 2.52E-06 | 1.20E-09 | 8.00E-10 | 0 | 0 | 6.42E-10 | 0 | 4.02E-09 | 2.53E-06 |
| Intermediate- and low-level radioactive waste, conditioned, to final repository | kg | 2.37E-03 | 1.01E-06 | 6.73E-07 | 0 | 0 | 5.42E-07 | 0 | 3.59E-06 | 2.37E-03 |
| Components for re-use | kg | 0.00E+00 | 0.00E+00 | 0.00E+00 | 0 | 0 | 0.00E+00 | 0 | 0.00E+00 | 0.00E+00 |
| Materials for recycling | kg | 0.00E+00 | 0.00E+00 | 6.27E-02 | 0 | 0 | 0.00E+00 | 0 | 0.00E+00 | 6.27E-02 |
| Materials for energy recovery | kg | 0.00E+00 | 0.00E+00 | 0.00E+00 | 0 | 0 | 0.00E+00 | 0 | 0.00E+00 | 0.00E+00 |
| Exported energy | MJ, LHV | 0.00E+00 | 0.00E+00 | 0.00E+00 | 0 | 0 | 0.00E+00 | 0 | 0.00E+00 | 0.00E+00 |
| Carbon emissions and removals | ||||||||||
| Biogenic carbon removal from product | kg CO₂ | 2.82E-01 | 0.00E+00 | 0.00E+00 | 0 | 0 | 0.00E+00 | 0 | 0.00E+00 | 2.82E-01 |
| Biogenic carbon emission from product | kg CO₂ | 1.44E-01 | 0.00E+00 | 0.00E+00 | 0 | 0 | 0.00E+00 | 0 | 1.67E-03 | 1.46E-01 |
| Biogenic carbon removal from packaging | kg CO₂ | 2.49E-02 | 0.00E+00 | 0.00E+00 | 0 | 0 | 0.00E+00 | 0 | 0.00E+00 | 2.49E-02 |
| Biogenic carbon emission from packaging | kg CO₂ | 0.00E+00 | 0.00E+00 | 2.58E-03 | 0 | 0 | 0.00E+00 | 0 | 0.00E+00 | 2.58E-03 |
| Biogenic carbon emission from combustion of waste | kg CO₂ | 0.00E+00 | 0.00E+00 | 8.67E-04 | 0 | 0 | 0.00E+00 | 0 | 0.00E+00 | 8.67E-04 |
| Calcination carbon emissions | kg CO₂ | 0.00E+00 | 0.00E+00 | 0.00E+00 | 0 | 0 | 0.00E+00 | 0 | 0.00E+00 | 0.00E+00 |
| Carbonation carbon removals | kg CO₂ | 0.00E+00 | 0.00E+00 | 0.00E+00 | 0 | 0 | 0.00E+00 | 0 | 0.00E+00 | 0.00E+00 |
| Carbon emissions from combustion of waste from renewable sources used in production processes + Carbon emissions from combustion of waste from non renewable sources used in production processes |
kg CO₂ | 0.00E+00 | 0.00E+00 | 0.00E+00 | 0 | 0 | 0.00E+00 | 0 | 0.00E+00 | 0.00E+00 |
Atmosphere™ Duct Liner produced in Shelbyville, IN: LCIA results, resource use, output and waste flows, and carbon emissions & removals per functional unit
| Parameter | Unit | A1-A3 | A4 | A5 | B1-B7 | C1 | C2 | C3 | C4 | Total |
| LCIA results | ||||||||||
| Global warming | kg CO₂ eq | 3.34E+00 | 3.15E-02 | 1.22E-02 | 0 | 0 | 1.67E-02 | 0 | 2.17E-02 | 3.43E+00 |
| Ozone depletion | kg CFC-11 eq | 1.30E-11 | 7.03E-17 | 9.29E-17 | 0 | 0 | 3.73E-17 | 0 | 1.07E-15 | 1.30E-11 |
| Acidification | kg SO₂ eq | 7.68E-03 | 1.62E-04 | 1.27E-05 | 0 | 0 | 4.57E-05 | 0 | 1.15E-04 | 8.02E-03 |
| Eutrophication | kg N eq | 2.43E-03 | 1.38E-05 | 3.61E-06 | 0 | 0 | 4.84E-06 | 0 | 5.06E-06 | 2.45E-03 |
| Smog | kg O₃ eq | 1.09E-01 | 5.54E-03 | 1.11E-04 | 0 | 0 | 1.04E-03 | 0 | 2.10E-03 | 1.18E-01 |
| Respiratory effects | kg PM2.5 eq | 4.29E-04 | 7.90E-06 | 4.32E-07 | 0 | 0 | 1.96E-06 | 0 | 8.90E-06 | 4.48E-04 |
| Additional environmental information | ||||||||||
| Carcinogenics | CTUh | 99.1% | 0.1% | 0.0% | 0.0% | 0.0% | 0.0% | 0.0% | 0.8% | 100% |
| Non-carcinogenics | CTUh | 98.9% | 0.1% | 0.0% | 0.0% | 0.0% | 0.0% | 0.0% | 1.0% | 100% |
| Ecotoxicity | CTUe | 98.9% | 0.5% | 0.0% | 0.0% | 0.0% | 0.3% | 0.0% | 0.3% | 100% |
| Fossil fuel depletion | MJ surplus | 6.45E+00 | 5.91E-02 | 2.62E-03 | 0 | 0 | 3.13E-02 | 0 | 4.38E-02 | 6.58E+00 |
| Resource use indicators | ||||||||||
| Renewable primary energy used as energy carrier (fuel) | MJ, LHV | 1.27E+01 | 1.74E-02 | 3.80E-03 | 0 | 0 | 9.21E-03 | 0 | 4.08E-02 | 1.27E+01 |
| Renewable primary resources with energy content used as material | MJ, LHV | 1.99E-05 | -1.44E-12 | 8.59E-13 | 0 | 0 | -7.62E-13 | 0 | 8.12E-12 | 1.99E-05 |
| Non-renewable primary resources used as an energy carrier (fuel) | MJ, LHV | 6.19E+01 | 4.46E-01 | 2.70E-02 | 0 | 0 | 2.36E-01 | 0 | 3.48E-01 | 6.29E+01 |
| Non-renewable primary resources with energy content used as material | MJ, LHV | 3.32E-07 | 1.78E-09 | 7.00E-11 | 0 | 0 | 9.42E-10 | 0 | 8.68E-10 | 3.36E-07 |
| Secondary materials | kg | 2.50E-01 | 0.00E+00 | 0.00E+00 | 0 | 0 | 0.00E+00 | 0 | 0.00E+00 | 2.50E-01 |
| Renewable secondary fuels | MJ, LHV | 0.00E+00 | 0.00E+00 | 0.00E+00 | 0 | 0 | 0.00E+00 | 0 | 0.00E+00 | 0.00E+00 |
| Non-renewable secondary fuels | MJ, LHV | 0.00E+00 | 0.00E+00 | 0.00E+00 | 0 | 0 | 0.00E+00 | 0 | 0.00E+00 | 0.00E+00 |
| Recovered energy | MJ, LHV | 0.00E+00 | 0.00E+00 | 0.00E+00 | 0 | 0 | 0.00E+00 | 0 | 0.00E+00 | 0.00E+00 |
| Use of net fresh water resources | m³ | 8.32E-01 | 6.03E-05 | 2.23E-05 | 0 | 0 | 3.20E-05 | 0 | 4.32E-05 | 8.32E-01 |
| Abiotic depletion potential, fossil | MJ, LHV | 5.32E+01 | 4.43E-01 | 2.34E-02 | 0 | 0 | 2.35E-01 | 0 | 3.37E-01 | 5.42E+01 |
| Output flows and waste category indicators | ||||||||||
| Hazardous waste disposed | kg | 0.00E+00 | 0.00E+00 | 0.00E+00 | 0 | 0 | 0.00E+00 | 0 | 0.00E+00 | 0.00E+00 |
| Non-hazardous waste disposed | kg | 1.48E-01 | 0.00E+00 | 6.11E-02 | 0 | 0 | 0.00E+00 | 0 | 9.39E-01 | 1.15E+00 |
| High-level radioactive waste | kg | 3.13E-06 | 1.30E-09 | 1.51E-09 | 0 | 0 | 6.89E-10 | 0 | 4.31E-09 | 3.14E-06 |
| Intermediate- and low-level radioactive waste, conditioned, to final repository | kg | 3.01E-03 | 1.09E-06 | 1.27E-06 | 0 | 0 | 5.80E-07 | 0 | 3.85E-06 | 3.01E-03 |
| Components for re-use | kg | 0.00E+00 | 0.00E+00 | 0.00E+00 | 0 | 0 | 0.00E+00 | 0 | 0.00E+00 | 0.00E+00 |
| Materials for recycling | kg | 0.00E+00 | 0.00E+00 | 5.67E-02 | 0 | 0 | 0.00E+00 | 0 | 0.00E+00 | 5.67E-02 |
| Materials for energy recovery | kg | 0.00E+00 | 0.00E+00 | 0.00E+00 | 0 | 0 | 0.00E+00 | 0 | 0.00E+00 | 0.00E+00 |
| Exported energy | MJ, LHV | 0.00E+00 | 0.00E+00 | 0.00E+00 | 0 | 0 | 0.00E+00 | 0 | 0.00E+00 | 0.00E+00 |
| Carbon emissions and removals | ||||||||||
| Biogenic carbon removal from product | kg CO₂ | 5.28E-01 | 0.00E+00 | 0.00E+00 | 0 | 0 | 0.00E+00 | 0 | 0.00E+00 | 5.28E-01 |
| Biogenic carbon emission from product | kg CO₂ | 2.17E-01 | 0.00E+00 | 0.00E+00 | 0 | 0 | 0.00E+00 | 0 | 1.79E-03 | 2.19E-01 |
| Biogenic carbon removal from packaging | kg CO₂ | 2.97E-02 | 0.00E+00 | 0.00E+00 | 0 | 0 | 0.00E+00 | 0 | 0.00E+00 | 2.97E-02 |
| Biogenic carbon emission from packaging | kg CO₂ | 0.00E+00 | 0.00E+00 | 6.46E-04 | 0 | 0 | 0.00E+00 | 0 | 0.00E+00 | 6.46E-04 |
| Biogenic carbon emission from combustion of waste | kg CO₂ | 0.00E+00 | 0.00E+00 | 1.00E-03 | 0 | 0 | 0.00E+00 | 0 | 0.00E+00 | 1.00E-03 |
| Calcination carbon emissions | kg CO₂ | 0.00E+00 | 0.00E+00 | 0.00E+00 | 0 | 0 | 0.00E+00 | 0 | 0.00E+00 | 0.00E+00 |
| Carbonation carbon removals | kg CO₂ | 0.00E+00 | 0.00E+00 | 0.00E+00 | 0 | 0 | 0.00E+00 | 0 | 0.00E+00 | 0.00E+00 |
Carbon emissions from combustion of waste from renewable sources used in production processes + Carbon emissions from combustion of waste from non renewable sources used in production processes |
kg CO₂ | 0.00E+00 | 0.00E+00 | 0.00E+00 | 0 | 0 | 0.00E+00 | 0 | 0.00E+00 | 0.00E+00 |