LCA results & interpretation STRUCTODEK HD
Scope and summary
- Cradle to gate
- Cradle to gate with options
- Cradle to grave
Application
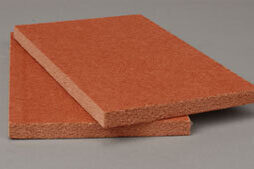
STRUCTODEK HD is a non-asphaltic fiberboard for roofing. It can be used as an insulation board, cover board, or re-roof/recover board. The product is a high-density roofing board designed for low-slope single-ply and traditional roof system applications. The coating enhances adhesion with single-ply membranes like PVC, TPO, EPDM, and CSPE. It is compatible with low VOC, water-based, foam, and traditional adhesives. It supports peel-and-stick and BUR systems with proprietary coating, minimizing adhesive absorption and ensuring strong bonds. Moisture-resistant components protect edges during use and cutting. It provides sound-deadening and thermal insulation (R-value of 1.3 per ½”). Its compressive strength is 25 psi at 10% deformation. Panels are fiberglass-free, easy to cut, and come in 4'x4' or 4'x8' sizes.
Declared unit
One cubic meter weighs 266 kg (266 kg/m³). To fulfill the declared unit, 78.7 individual 1 m2 panels at ½” (12.7 mm) thickness are needed. The panel's moisture content is 0.5% max.
Manufacturing data
Reporting period: January 2023 – December 2023
Location: Danville, VA
Sensitivity analysis
Sensitivity analyses were performed to check the robustness of the results where the highest potential environmental impacts are occurring. As the bulk of impacts are attributed to manufacturing activities, electricity usage was selected for sensitivity analysis.
Global warming potential was evaluated for sensitivity since BLUE RIDGE FIBERBOARD is interested in the potential CO2-equivalent emissions of its products. By increasing the renewable energy percentage from 7%, reflecting the residual mix for the manufacturing facility subregion, to approximately 50%, potential CO2-equivalent emissions could be reduced by approximately 20.0%. This shows that global warming potential is sensitive to increases in electricity from renewable energy sources.
Embodied carbon
Embodied carbon can be defined as the cradle-to-gate (A1-A3) global warming potential impacts. The total embodied carbon per declared unit of STRUCTODEK HD is 2.08E+02 kg CO2-eq.
What’s causing the greatest impacts
All life cycle stages
The raw material acquisition stage dominates the results, accounting for over 54% of the total impacts for seven life cycle impact categories, followed by the manufacturing stage. For smog, global warming, ozone depletion, and fossil fuel depletion, manufacturing accounted for over 50% of the total results. The biobased binder was the largest contributor to total results among the raw materials.
Raw material acquisition
The raw material acquisition (A1) stage has the most significant contribution to most impact categories, primarily due to the biobased binder. While the wood chips account for a much larger share by weight of the raw materials, the use of post-industrial wood chips reduces its contribution to the potential impacts. The starch component in the binder contributed to over 50% of impacts for seven out of ten impact categories.
Transportation
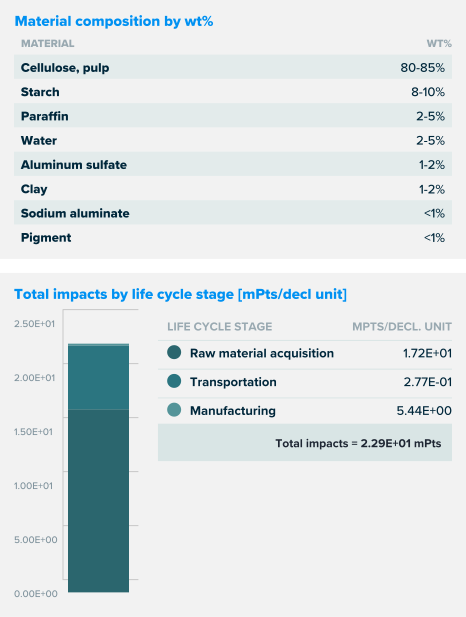
The transportation (A2) of raw materials is the least impactful contributor to the total results. Materials are sourced from within America and transported via semi-truck to the manufacturing facility.
Manufacturing
Manufacturing (A3) is the second highest contributor to most impact categories. The primary driver of environmental impacts within the manufacturing stage is the energy required to produce the panels. However, impacts from the manufacturing stage dominate the results for global warming, ozone depletion, and fossil fuel depletion, stemming primarily from the use of electricity and natural gas. Activities in this stage also include final product packaging and manufacturing waste disposal.
How we're making it greener
BLUE RIDGE FIBERBOARD is committed to producing products and systems to reduce our energy usage, material resource consumption, and environmental impact. Products are composed primarily of all-natural, earth-friendly carbon-sequestering wood chips and use a biobased binder.
WOOD IS A CARBON-SMART BUILDING MATERIAL CHOICE
- Reducing and reversing the acceleration of global warming happens by making carbon-smart choices. The wood in BLUE RIDGE FIBERBOARD products captures and stores the CO2 inherent in wood fibers, which locks up this carbon for the installation's lifetime.
- Trees take up carbon dioxide through photosynthesis and store it in wood fibers. Softwood chips used as the source material for our products, lock in carbon for the life of the building installation.
- As trees grow, they absorb carbon dioxide from the atmosphere during the process of photosynthesis, emitting oxygen and utilizing the carbon to create the tree's very roots, trunk, branches, and leaves. This process is called carbon sequestration, which captures and stores carbon dioxide from the atmosphere. One cubic meter of wood can trap approximately 1 ton of carbon dioxide. To put this concept in perspective, the EPA states an average car emits about 4.6 metric tons of CO2 per year.
- UNECE (United Nations Economic Commission for Europe) emphasizes that the use of wood in the construction industry reduces CO2 emission by 30% when used instead of steel. Throughout the life of a wooden structure, its wood components store and restrict the release of carbon dioxide.
RESPONSIBLE WOOD SOURCING
BLUE RIDGE FIBERBOARD responsibly sources 100% of its wood. We work with suppliers adhering to responsible sourcing principles. Wood supplied to us comes from a known source, is legally harvested and traded, and does not threaten high conservation value. It does not come from deforestation or other ecosystem conversion, which leads to biodiversity loss, including that of rare, threatened, and endangered species, and it is not endangered. It is harvested and produced, ensuring that human and worker rights are protected, including decent and humane working conditions and no forced labor.
LCA results
| Life cycle stage | A1 Raw material acquisition | A2 Transport | A3 Manufacturing |
|
Information modules:
|
(X) A1 Raw material acquisition | (X) A2 Transport | (X) A3 Manufacturing |
 |
 |
 |
SM Single Score
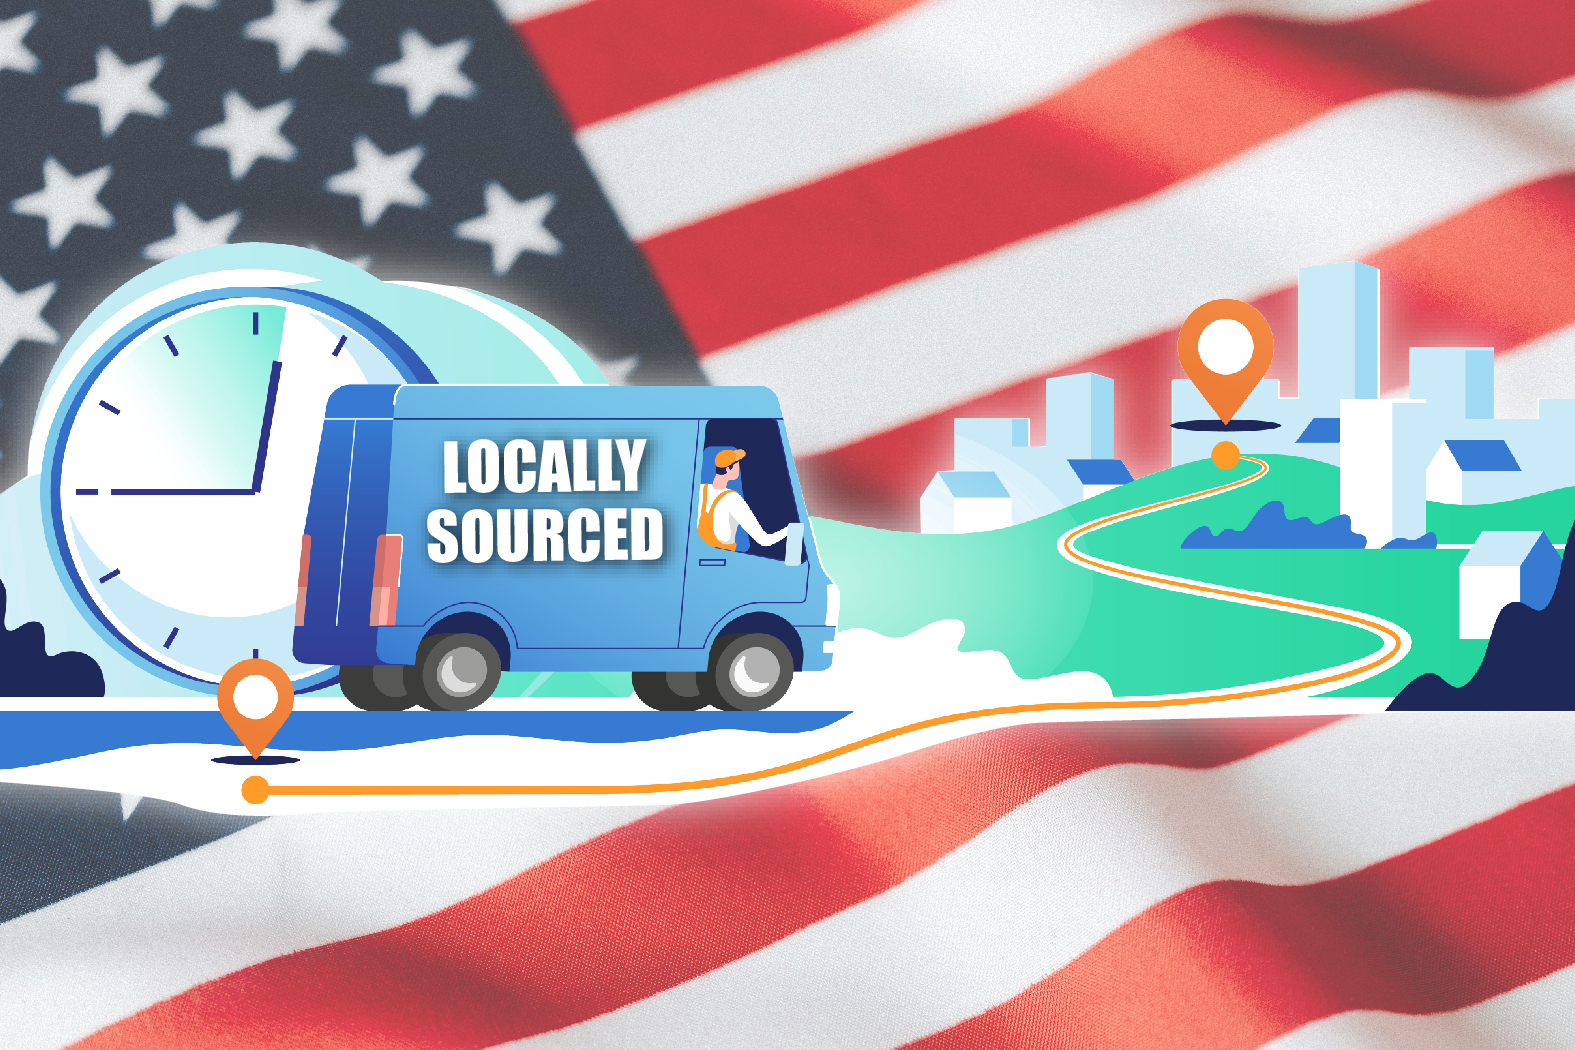
Learn about SM Single Score results| Impacts per declared unit | 1.72E+01 mPts | 2.77E-01 mPts | 5.44E+00 mPts |
| Materials or processes contributing >20% to total impacts in each life cycle stage | Extraction and preprocessing of starch component in biobased binder. | Truck transportation to manufacturing facility. | Electricity and natural gas consumption during manufacturing process. |
Life cycle impact results per declared unit
| Life cycle stage | A1 Raw material supply | A2 Transport | A3 Manufacturing |
Ecological damage
Human health damage
Additional environmental information
References
LCA Background Report
LCA of W. R. Meadows BLUE RIDGE FIBERBOARD products (public version), 2025. Developed using the IPCC Fifth Assessment Report (AR5) 100-year time, TRACI v2.1, CML, and Cumulative Energy Demand (LHV) impact assessment methodologies, SimaPro Analyst 9.6 software, and ecoinvent v3.10 and US-EI 2.2 databases.
ISO 14025: 2006 Environmental labels and declarations — Type III environmental declarations — Principles and procedures.
ISO 21930: 2017, Sustainability in buildings and civil engineering works -- Core rules for environmental product declarations of construction products and services serves as the core PCR.
UL Part A: Life Cycle Assessment Calculation Rules and Report Requirements v4.0
March 2022. PCR review conducted by Lindita Bushi, PhD, Senior Research Associate (Athena Sustainable Materials Institute), [email protected]; Hugues Imbeault-Tétreault (Group AGECO); and Jack Geibig (Ecoform).
UL Part B: Structural and Architectural Wood Products EPD Requirements, v1.1
May 2020. PCR review conducted by Dr. Thomas Gloria, Chair (Industrial Ecology Consultants), [email protected]; Dr. Indro Ganguly (University of Washington); and Dr. Sahoo (University of Georgia).
UL Environment General Program Instructions v2.5, March 2020 (available upon request)
Download PDF SM Transparency Report [EPD]™
SM Transparency Reports (TR) are ISO 14025 Type III environmental declarations (EPD) that enable purchasers and users to compare the potential environmental performance of products on a life cycle basis. Environmental declarations from different programs (ISO 14025) may not be comparable. Comparison of the environmental performance using EPD information shall consider all relevant information modules over the full life cycle of the products within the building. This PCR allows EPD comparability only when the same functional requirements between products are ensured and the requirements of ISO 21930:2017 §5.5 are met. It should be noted that different LCA software and background LCI datasets may lead to differences results for upstream or downstream of the life cycle stages declared. LCIA results are relative expressions and do not predict impacts on category endpoints, the exceeding of thresholds, safety margins or risks. These six impact categories are globally deemed mature enough to be included in Type III environmental declarations. Other categories are being developed and defined and LCA should continue making advances in their development. However, the EPD users shall not use additional measures for comparative purposes. Comparison of the environmental performance of structural and architectural wood products using EPD information shall be based on the product’s use and impacts at the construction works level, and therefore EPDs may not be used for comparability purposes when not considering the construction works energy use phase as instructed under this PCR. Full conformance with the PCR for structural and architectural wood products allows EPD comparability only when all stages of a life cycle have been considered, when they comply with all referenced standards, use the same sub-category Part B PCR, and use equivalent scenarios with respect to construction works. However, variations and deviations are possible. Example of variations: Different LCA software and background LCI datasets may lead to differences results for upstream or downstream of the life cycle stages declared.
 SM Transparency Report (EPD)