EPD additional content Aurora™ One-Piece Toilet
Data
Background This product-specific plant-specific declaration was created by collecting production data from the facility in TOTO’s Vietnam (TVN) plant in Hanoi, Vietnam. All unit processes were modeled using primary data. Secondary data sources include those available in the ecoinvent v3.11, US-EI 2.2, and Industry data 2.0 databases.
Allocation Allocations of multi-input and multi-output processes follow a mass-based approach in the collected data, which is the most appropriate for the unit processes modeled. Allocation approaches in the background data follow the ecoinvent methodology. No co-product allocations were made in the model.
Cut-off criteria for the inclusion of mass and energy flows are 1% of renewable primary resource (energy) usage, 1% nonrenewable primary resource (energy) usage, 1% of the total mass input of that unit process, and 1% of environmental impacts. The total of neglected input flows per module does not exceed 5% of energy usage, mass, and environmental impacts. The only exceptions to these criteria are substances with hazardous and toxic properties, which must be listed even when the given process unit is under the cut-off criterion of 1% of the total mass. However, neither toilet contains hazardous substances according to the standards or regulations of the Resource Conservation and Recovery Act (RCRA), Subtitle C. Barring insignificant quantities of wastewater treatment chemicals and reused resin molds, no known flows are deliberately excluded; therefore, these criteria have been met. The completeness of the bill of materials defined in this report satisfies the above-defined cut-off criteria.
Data quality assessment
Precision: As the relevant foreground data is primary data or modeled based on primary information sources of the owner of the technology, precision is considered to be high. Background data are from the ecoinvent v3.11 and US-EI 2.2 databases with documented precision to the extent available.
Completeness: TOTO worked with its manufacturing partners to obtain a comprehensive set of primary data associated with the manufacturing processes. The product system was checked for mass balance and completeness of the inventory. The data set was considered complete based on our understanding of the manufacturing site and a review with key stakeholders on the TOTO team, and cut-off criteria were observed consistent with those prescribed in the PCR. Besides capital equipment, no data was knowingly omitted.
Consistency: Primary data were collected with a similar level of detail, while background data were sourced primarily from the ecoinvent database. Other databases were used if data were not available in ecoinvent, or the data set was judged to be more representative. Other methodological choices were made consistently throughout the model.
Data sets contributing 5% or more to any environmental impact category
| Data set name | Database name and version | Geography | Allocation method |
| Sewage treatment | US-EI 2.2 | United States | By mass |
| Electricity mix 2021 | US-EI 2.2 | United States | By mass |
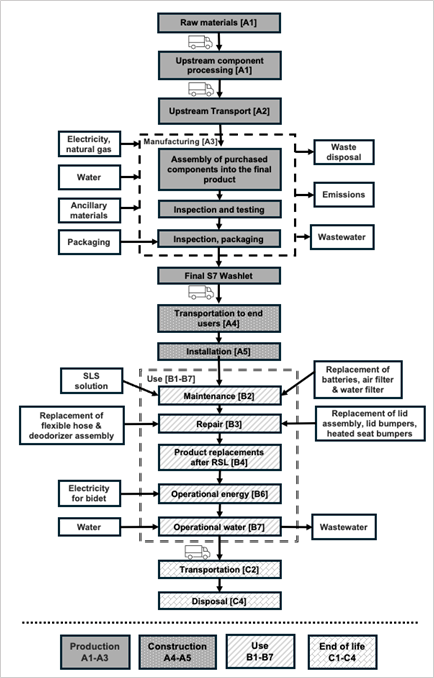
Flow diagram
Scenarios and additional technical information
Distribution [A4]
| Resource category | Flow | Value | Unit |
| Manufacturing facility (Vietnam) to GA, US | Road transport in Vietnam | 54.84 | km |
| Sea transport | 17,818.50 | km | |
| Rail transport from port to GA, US | 3,509.68 | km | |
| Transport to final users | Road transport (83% share) | 1,421.05 | km |
| Rail transport (17% share) | 2,042.26 | km |
The Aurora toilets manufactured in Vietnam are first shipped to TOTO’s distribution center in Georgia, US and then transported to end users and building sites. Shipment to end users can occur via trucks or rail with trucks contributing to 83% of the shipments in 2025.
Installation [A5]
Installation of the product is manual with no additional resources being consumed. The inputs in this module include the disposal of packaging waste (plastic bags and corrugated board) with a waste transportation distance of 100 km.
| Packaging waste | Flow |
| Plastic bags | Recycled - 80.88% |
| Landfilled - 15.37% | |
| Incinerated - 3.75% | |
| Corrugated board | Recycled - 13.63% |
| Landfilled - 69.44% |
End-of-life stage [C1-C4]
This module represents the final waste disposal including the physical treatment and management of the disposal site. Per the PCR, 100% of the discarded product is sent to sanitary landfills.
Name | Value | Unit |
Transport from building site to landfill | 100 | km |
Mixed construction waste | 59.7 | kg |
Landfilling total | 59.7 | kg |
Product information
| Product family | Product models | Certifications |
| Aurora 1.28gpf Toilets | CST686CEFGAT40#** | Meets and exceeds: ASME A112.19.2/CSA B45.1 Certifications: IAPMO(cUPC) Code compliance with UPC, IPC, NSPC, NPC Canada, and others |
| MS686124CEFG#** | ||
| MS686124CEF#** | ||
| MS686124CEFRG#** | ||
| MS686234CEFG#** | ||
| Aurora 1.0gpf (1G) Toilets | CST686CUFGAT40#** | Meets and exceeds: ASME A112.19.2/CSA B45.1 Certifications: IAPMO(cUPC) Code compliance with UPC, IPC, NSPC, NPC Canada, and others |
| MS686124CUFG#** | ||
| MS686124CUF#** | ||
| MS686124CUFRG#** | ||
| MS686234CUFG#** |
Major system boundary exclusions
- Construction of major capital equipment
- Maintenance and operation of support equipment
- Human labor and employee transport
- Manufacture and transport of packaging materials not associated with final product
- Energy consumption in warehouses, distribution centers, and retail facilities during the course of transport to the final customer
- Disposal of packaging materials not associated with final product
- Building operational energy and water use
Major assumptions and limitations
- Available ecoinvent data sets were manually updated to represent the upstream component production in the supplier country. However, actual manufacturing operations and resources consumed for each component might vary.
- Generic data sets used for material inputs, transportation, and waste processing are considered good quality, but actual impacts from material suppliers, transport carriers, and local waste processing may vary.
- The impacts of resin molds, expected to be minimal, in ceramic production is excluded from the study.
- Some chemicals used in wastewater treatment in ceramic production plant with minimal share (annual facility consumption <= 1 kg) has been excluded.
- For materials with unknown suppliers and transport distances, a generic value of 2,000 km was used as suggested by PCR. However, actual transport distances might vary.
The reported values for all indicators in the below tables for B1, B5, and C1 are zero.
Aurora 1.28gpf - LCIA results, resource use, output and waste flows, and carbon emissions & removals per functional unit
| Impact categories | Unit | A1-A3 | A4 | A5 | B2 | B3 | B4 | B7 | C2 | C4 |
| Ozone depletion | kg CFC-11 eq | 3.51E-06 | 8.09E-09 | 1.03E-07 | 1.12E-07 | 4.33E-07 | 1.95E-05 | 2.94E-05 | 5.78E-10 | 9.47E-10 |
| Global warming | kg CO2 eq | 1.89E+02 | 1.06E+01 | 3.09E+00 | 3.51E+00 | 5.49E+00 | 1.07E+03 | 1.25E+03 | 6.16E-01 | 5.30E-01 |
| Smog | kg O3 eq | 1.95E+01 | 4.07E+00 | 1.01E+01 | 1.70E-01 | 4.58E-01 | 1.45E+02 | 4.93E+01 | 9.82E-02 | 6.83E-02 |
| Acidification | kg SO2 eq | 9.31E-01 | 1.38E-01 | 2.85E-01 | 1.95E-02 | 6.16E-02 | 6.20E+00 | 5.02E+00 | 3.41E-03 | 2.42E-03 |
| Respiratory effects | kg PM2.5 eq | 5.89E-02 | 2.26E-03 | 3.05E-03 | 1.68E-03 | 7.67E-03 | 3.26E-01 | 3.85E-01 | 5.32E-05 | 2.54E-04 |
| Freshwater eutrophication | kg P eq | 4.16E-03 | 2.33E-05 | 2.28E-05 | 6.63E-05 | 2.65E-03 | 2.16E-02 | 2.76E-02 | 1.38E-06 | 4.54E-06 |
| Marine eutrophication | kg N eq | 1.67E-01 | 3.39E-02 | 8.47E-02 | 1.63E-03 | 4.94E-03 | 1.23E+00 | 4.36E-01 | 8.21E-04 | 5.89E-04 |
| Additional impact categories | ||||||||||
| Carcinogenics | CTUh | 3.06E-06 | 1.46E-07 | 1.06E-08 | 7.15E-08 | 2.49E-07 | 1.68E-05 | 3.01E-05 | 8.52E-09 | 3.58E-09 |
| Non carcinogenics | CTUh | 3.36E-05 | 1.37E-06 | 1.01E-07 | 7.01E-07 | 3.16E-05 | 1.86E-04 | 1.06E-04 | 7.95E-08 | 1.91E-08 |
| Ecotoxicity | CTUe | 1.64E+02 | 2.62E+01 | 1.64E+00 | 1.72E+00 | 3.85E+01 | 9.74E+02 | 4.88E+02 | 1.52E+00 | 3.63E-01 |
| Resource use indicators | ||||||||||
| Renewable primary energy used as energy carrier (fuel) | MJ, NCV | 5.79E+02 | 2.56E-01 | 3.35E-01 | 6.02E+00 | 2.05E+00 | 6.72E+03 | 2.09E+03 | 1.73E-02 | 6.09E-02 |
| Renewable primary resources with energy content used as material | MJ, NCV | 0.00E+00 | 0.00E+00 | 0.00E+00 | 0.00E+00 | 0.00E+00 | 0.00E+00 | 0.00E+00 | 0.00E+00 | 0.00E+00 |
| Total use of renewable primary resources with energy content | MJ, NCV | 5.79E+02 | 2.56E-01 | 3.35E-01 | 6.02E+00 | 2.05E+00 | 6.72E+03 | 2.09E+03 | 1.73E-02 | 6.09E-02 |
| Non-renewable primary resources used as an energy carrier (fuel) | MJ, NCV | 3.01E+03 | 1.30E+02 | 8.53E+00 | 8.15E+01 | 2.78E+01 | 6.77E+04 | 2.06E+04 | 3.96E+00 | 4.45E+00 |
| Non-renewable primary resources with energy content used as material | MJ, NCV | 1.99E+01 | 3.86E+00 | 3.86E+00 | 3.86E+00 | 0.00E+00 | 5.88E+01 | 0.00E+00 | 3.86E+00 | 3.86E+00 |
| Total use of non-renewable primary resources with energy content | MJ, NCV | 3.03E+03 | 1.34E+02 | 1.24E+01 | 8.53E+01 | 2.78E+01 | 6.78E+04 | 2.06E+04 | 7.82E+00 | 8.31E+00 |
| Secondary materials | kg | 0.00E+00 | 0.00E+00 | 0.00E+00 | 0.00E+00 | 0.00E+00 | 0.00E+00 | 0.00E+00 | 0.00E+00 | 0.00E+00 |
| Renewable secondary fuels | MJ, NCV | 0.00E+00 | 0.00E+00 | 0.00E+00 | 0.00E+00 | 0.00E+00 | 0.00E+00 | 0.00E+00 | 0.00E+00 | 0.00E+00 |
| Non-renewable secondary fuels | MJ, NCV | 0.00E+00 | 0.00E+00 | 0.00E+00 | 0.00E+00 | 0.00E+00 | 0.00E+00 | 0.00E+00 | 0.00E+00 | 0.00E+00 |
| Recovered energy | MJ, NCV | 0.00E+00 | 0.00E+00 | 0.00E+00 | 0.00E+00 | 0.00E+00 | 0.00E+00 | 0.00E+00 | 0.00E+00 | 0.00E+00 |
| Use of net fresh water resources | m3 | 9.14E-04 | 1.70E-03 | 1.61E-03 | 1.02E-03 | 0.00E+00 | 3.05E-04 | 8.20E-04 | 7.30E-04 | 7.80E-04 |
| Abiotic depletion potential (fossil) | MJ, LHV | 2.72E+03 | 1.32E+02 | 1.15E+01 | 7.87E+01 | 9.01E+01 | 1.52E+04 | 1.46E+04 | 7.71E+00 | 8.11E+00 |
| Output flows and waste category indicators | ||||||||||
| Hazardous waste disposed | kg | 6.40E-01 | 0.00E+00 | 0.00E+00 | 0.00E+00 | 0.00E+00 | 0.00E+00 | 0.00E+00 | 0.00E+00 | 0.00E+00 |
| Non-hazardous waste disposed | kg | 2.99E+01 | 1.20E+00 | 1.43E+00 | 2.93E+01 | 1.11E+00 | 1.32E+02 | 0.00E+00 | 5.40E-01 | 2.59E+01 |
| High-level radioactive waste, conditioned, to final repository | kg | 7.81E-03 | 5.93E-04 | 3.89E-05 | 3.44E-04 | 0.00E+00 | 1.47E+01 | 1.51E+01 | 1.61E-06 | 4.81E-06 |
| Intermediate- and low-level radioactive waste, conditioned, to final repository | kg | 4.07E-05 | 3.38E-07 | 1.25E-07 | 7.76E-07 | 4.14E-07 | 8.05E-05 | 5.58E-05 | 1.54E-08 | 2.46E-08 |
| Components for re-use | kg | 0.00E+00 | 0.00E+00 | 0.00E+00 | 0.00E+00 | 0.00E+00 | 0.00E+00 | 0.00E+00 | 0.00E+00 | 0.00E+00 |
| Materials for recycling | kg | 0.00E+00 | 0.00E+00 | 0.00E+00 | 2.93E+01 | 0.00E+00 | 4.45E+01 | 0.00E+00 | 2.20E-01 | 2.20E-01 |
| Materials for energy recovery | kg | 0.00E+00 | 0.00E+00 | 0.00E+00 | 0.00E+00 | 0.00E+00 | 0.00E+00 | 0.00E+00 | 0.00E+00 | 0.00E+00 |
| Exported energy | MJ | 0.00E+00 | 0.00E+00 | 0.00E+00 | 0.00E+00 | 0.00E+00 | 0.00E+00 | 0.00E+00 | 0.00E+00 | 0.00E+00 |
| Carbon emissions and removals | ||||||||||
| Biogenic Carbon Removal from Product | kg CO2 | 0.00E+00 | 0.00E+00 | 0.00E+00 | 0.00E+00 | 0.00E+00 | 0.00E+00 | 0.00E+00 | 0.00E+00 | 0.00E+00 |
| Biogenic Carbon Emission from Product | kg CO2 | 0.00E+00 | 0.00E+00 | 0.00E+00 | 0.00E+00 | 0.00E+00 | 0.00E+00 | 0.00E+00 | 0.00E+00 | 0.00E+00 |
| Biogenic Carbon Removal from Packaging | kg CO2 | 7.00E+00 | 0.00E+00 | 0.00E+00 | 0.00E+00 | 0.00E+00 | 1.05E+01 | 0.00E+00 | 0.00E+00 | 0.00E+00 |
| Biogenic Carbon Emission from Packaging | kg CO2 | 0.00E+00 | 0.00E+00 | 7.00E+00 | 0.00E+00 | 0.00E+00 | 1.05E+01 | 0.00E+00 | 0.00E+00 | 0.00E+00 |
| Biogenic Carbon Emission from Combustion of Waste from Renewable Sources Used in Production Processes | kg CO2 | 0.00E+00 | 0.00E+00 | 0.00E+00 | 0.00E+00 | 0.00E+00 | 0.00E+00 | 0.00E+00 | 0.00E+00 | 0.00E+00 |
| Calcination Carbon Emissions | kg CO2 | 0.00E+00 | 0.00E+00 | 0.00E+00 | 0.00E+00 | 0.00E+00 | 0.00E+00 | 0.00E+00 | 0.00E+00 | 0.00E+00 |
| Carbonation Carbon Removals | kg CO2 | 0.00E+00 | 0.00E+00 | 0.00E+00 | 0.00E+00 | 0.00E+00 | 0.00E+00 | 0.00E+00 | 0.00E+00 | 0.00E+00 |
| Carbon Emissions from Combustion of Waste from Renewable and Non-Renewable Sources used in Production Processes | kg CO2 | 0.00E+00 | 0.00E+00 | 0.00E+00 | 0.00E+00 | 0.00E+00 | 0.00E+00 | 0.00E+00 | 0.00E+00 | 0.00E+00 |
Aurora 1.0gpf - LCIA results, resource use, output and waste flows, and carbon emissions & removals per functional unit
| Impact categories | Unit | A1-A3 | A4 | A5 | B2 | B3 | B4 | B7 | C2 | C4 |
| Ozone depletion | kg CFC-11 eq | 3.51E-06 | 8.09E-09 | 1.03E-07 | 1.12E-07 | 4.33E-07 | 1.95E-05 | 2.30E-05 | 5.78E-10 | 9.47E-10 |
| Global warming | kg CO2 eq | 1.89E+02 | 1.06E+01 | 3.09E+00 | 3.51E+00 | 5.49E+00 | 1.07E+03 | 9.79E+02 | 6.16E-01 | 5.30E-01 |
| Smog | kg O3 eq | 1.95E+01 | 4.07E+00 | 1.01E+01 | 1.70E-01 | 4.58E-01 | 1.45E+02 | 3.85E+01 | 9.82E-02 | 6.83E-02 |
| Acidification | kg SO2 eq | 9.31E-01 | 1.38E-01 | 2.85E-01 | 1.95E-02 | 6.16E-02 | 6.20E+00 | 3.93E+00 | 3.41E-03 | 2.42E-03 |
| Respiratory effects | kg PM2.5 eq | 5.89E-02 | 2.26E-03 | 3.05E-03 | 1.68E-03 | 7.67E-03 | 3.26E-01 | 3.00E-01 | 5.32E-05 | 2.54E-04 |
| Freshwater eutrophication | kg P eq | 4.16E-03 | 2.33E-05 | 2.28E-05 | 6.63E-05 | 2.65E-03 | 2.16E-02 | 2.16E-02 | 1.38E-06 | 4.54E-06 |
| Marine eutrophication | kg N eq | 1.67E-01 | 3.39E-02 | 8.47E-02 | 1.63E-03 | 4.94E-03 | 1.23E+00 | 3.40E-01 | 8.21E-04 | 5.89E-04 |
| Additional impact categories | ||||||||||
| Carcinogenics | CTUh | 3.06E-06 | 1.46E-07 | 1.06E-08 | 7.15E-08 | 2.49E-07 | 1.68E-05 | 2.35E-05 | 8.52E-09 | 3.58E-09 |
| Non carcinogenics | CTUh | 3.36E-05 | 1.37E-06 | 1.01E-07 | 7.01E-07 | 3.16E-05 | 1.86E-04 | 8.31E-05 | 7.95E-08 | 1.91E-08 |
| Ecotoxicity | CTUe | 1.64E+02 | 2.62E+01 | 1.64E+00 | 1.72E+00 | 3.85E+01 | 9.74E+02 | 3.82E+02 | 1.52E+00 | 3.63E-01 |
| Resource use indicators | ||||||||||
| Renewable primary energy used as energy carrier (fuel) | MJ, NCV | 5.79E+02 | 2.56E-01 | 3.35E-01 | 6.02E+00 | 2.05E+00 | 5.47E+03 | 1.63E+03 | 1.73E-02 | 6.09E-02 |
| Renewable primary resources with energy content used as material | MJ, NCV | 0.00E+00 | 0.00E+00 | 0.00E+00 | 0.00E+00 | 0.00E+00 | 0.00E+00 | 0.00E+00 | 0.00E+00 | 0.00E+00 |
| Total use of renewable primary resources with energy content | MJ, NCV | 5.79E+02 | 2.56E-01 | 3.35E-01 | 6.02E+00 | 2.05E+00 | 5.47E+03 | 1.63E+03 | 1.73E-02 | 6.09E-02 |
| Non-renewable primary resources used as an energy carrier (fuel) | MJ, NCV | 3.01E+03 | 1.30E+02 | 8.53E+00 | 8.15E+01 | 2.78E+01 | 5.53E+04 | 1.61E+04 | 3.96E+00 | 4.45E+00 |
| Non-renewable primary resources with energy content used as material | MJ, NCV | 1.99E+01 | 3.86E+00 | 3.86E+00 | 3.86E+00 | 0.00E+00 | 5.88E+01 | 0.00E+00 | 3.86E+00 | 3.86E+00 |
| Total use of non-renewable primary resources with energy content | MJ, NCV | 3.03E+03 | 1.34E+02 | 1.24E+01 | 8.53E+01 | 2.78E+01 | 5.54E+04 | 1.61E+04 | 7.82E+00 | 8.31E+00 |
| Secondary materials | kg | 0.00E+00 | 0.00E+00 | 0.00E+00 | 0.00E+00 | 0.00E+00 | 0.00E+00 | 0.00E+00 | 0.00E+00 | 0.00E+00 |
| Renewable secondary fuels | MJ, NCV | 0.00E+00 | 0.00E+00 | 0.00E+00 | 0.00E+00 | 0.00E+00 | 0.00E+00 | 0.00E+00 | 0.00E+00 | 0.00E+00 |
| Non-renewable secondary fuels | MJ, NCV | 0.00E+00 | 0.00E+00 | 0.00E+00 | 0.00E+00 | 0.00E+00 | 0.00E+00 | 0.00E+00 | 0.00E+00 | 0.00E+00 |
| Recovered energy | MJ, NCV | 0.00E+00 | 0.00E+00 | 0.00E+00 | 0.00E+00 | 0.00E+00 | 0.00E+00 | 0.00E+00 | 0.00E+00 | 0.00E+00 |
| Use of net fresh water resources | m3 | 1.20E-03 | 1.70E-03 | 1.61E-03 | 1.02E-03 | 0.00E+00 | 2.91E-04 | 6.40E-04 | 7.23E-04 | 7.80E-04 |
| Abiotic depletion potential (fossil) | MJ, LHV | 2.72E+03 | 1.32E+02 | 1.15E+01 | 7.87E+01 | 9.01E+01 | 1.52E+04 | 1.13E+04 | 7.71E+00 | 8.11E+00 |
| Output flows and waste category indicators | ||||||||||
| Hazardous waste disposed | kg | 6.40E-01 | 0.00E+00 | 0.00E+00 | 0.00E+00 | 0.00E+00 | 0.00E+00 | 0.00E+00 | 0.00E+00 | 0.00E+00 |
| Non-hazardous waste disposed | kg | 2.99E+01 | 1.20E+00 | 1.43E+00 | 2.93E+01 | 1.11E+00 | 1.32E+02 | 0.00E+00 | 5.40E-01 | 2.59E+01 |
| High-level radioactive waste, conditioned, to final repository | kg | 7.81E-03 | 5.93E-04 | 3.89E-05 | 3.44E-04 | 0.00E+00 | 1.47E+01 | 6.94E-02 | 1.61E-06 | 4.81E-06 |
| Intermediate- and low-level radioactive waste, conditioned, to final repository | kg | 4.07E-05 | 3.38E-07 | 1.25E-07 | 7.76E-07 | 4.14E-07 | 8.05E-05 | 6.37E-04 | 1.54E-08 | 2.46E-08 |
| Components for re-use | kg | 0.00E+00 | 0.00E+00 | 0.00E+00 | 0.00E+00 | 0.00E+00 | 0.00E+00 | 0.00E+00 | 0.00E+00 | 0.00E+00 |
| Materials for recycling | kg | 0.00E+00 | 0.00E+00 | 0.00E+00 | 2.93E+01 | 0.00E+00 | 4.45E+01 | 0.00E+00 | 2.20E-01 | 2.20E-01 |
| Materials for energy recovery | kg | 0.00E+00 | 0.00E+00 | 0.00E+00 | 0.00E+00 | 0.00E+00 | 0.00E+00 | 0.00E+00 | 0.00E+00 | 0.00E+00 |
| Exported energy | MJ | 0.00E+00 | 0.00E+00 | 0.00E+00 | 0.00E+00 | 0.00E+00 | 0.00E+00 | 0.00E+00 | 0.00E+00 | 0.00E+00 |
| Carbon emissions and removals | ||||||||||
| Biogenic Carbon Removal from Product | kg CO2 | 0.00E+00 | 0.00E+00 | 0.00E+00 | 0.00E+00 | 0.00E+00 | 0.00E+00 | 0.00E+00 | 0.00E+00 | 0.00E+00 |
| Biogenic Carbon Emission from Product | kg CO2 | 0.00E+00 | 0.00E+00 | 0.00E+00 | 0.00E+00 | 0.00E+00 | 0.00E+00 | 0.00E+00 | 0.00E+00 | 0.00E+00 |
| Biogenic Carbon Removal from Packaging | kg CO2 | 7.00E+00 | 0.00E+00 | 0.00E+00 | 0.00E+00 | 0.00E+00 | 1.05E+01 | 0.00E+00 | 0.00E+00 | 0.00E+00 |
| Biogenic Carbon Emission from Packaging | kg CO2 | 0.00E+00 | 0.00E+00 | 7.00E+00 | 0.00E+00 | 0.00E+00 | 1.05E+01 | 0.00E+00 | 0.00E+00 | 0.00E+00 |
| Biogenic Carbon Emission from Combustion of Waste from Renewable Sources Used in Production Processes | kg CO2 | 0.00E+00 | 0.00E+00 | 0.00E+00 | 0.00E+00 | 0.00E+00 | 0.00E+00 | 0.00E+00 | 0.00E+00 | 0.00E+00 |
| Calcination Carbon Emissions | kg CO2 | 0.00E+00 | 0.00E+00 | 0.00E+00 | 0.00E+00 | 0.00E+00 | 0.00E+00 | 0.00E+00 | 0.00E+00 | 0.00E+00 |
| Carbonation Carbon Removals | kg CO2 | 0.00E+00 | 0.00E+00 | 0.00E+00 | 0.00E+00 | 0.00E+00 | 0.00E+00 | 0.00E+00 | 0.00E+00 | 0.00E+00 |
| Carbon Emissions from Combustion of Waste from Renewable and Non-Renewable Sources used in Production Processes | kg CO2 | 0.00E+00 | 0.00E+00 | 0.00E+00 | 0.00E+00 | 0.00E+00 | 0.00E+00 | 0.00E+00 | 0.00E+00 | 0.00E+00 |