LCA results & interpretation Natural Stone Countertops
Scope and summary
- Cradle to gate
- Cradle to gate with options
- Cradle to grave
Product description
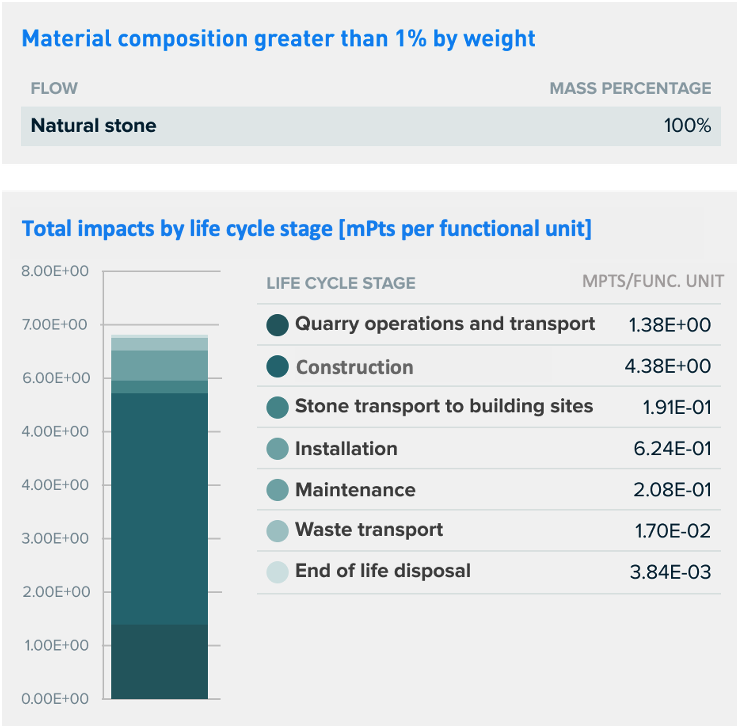
Countertops refer to a raised, flat, and horizontal surface, built for work mainly in kitchens, bathrooms, and workrooms. This surface is mostly supported by cabinets and is positioned at a suitable height for the user to perform the intended task. Countertops can be constructed of different materials with different attributes of functionality, durability, and aesthetics. Natural stone makes up 100% of the total mass of natural stone countertops and the different stone types included in this study are granite, marble, quartzite, limestone, sandstone, and soapstone.
Functional unit
The functional unit is one square meter of natural stone countertops for a service life of 10 years in residential use, inclusive of front edge and backsplash. The natural stone countertop product system is an industry-average product, i.e., the product profile represents the weighted average of NSI’s natural stone countertops based on NSI’s industry-average quarrying for all stone types and also includes industry-average production of countertops of all stone types. The product system in this study also includes the ancillary materials used in the installation of the product. NSI members produce only the natural stone component, while the installer purchases the ancillary materials separately.
Functional mass - 92.23 kg per m2
Thickness - 28.58 mm (industry-weighted average)
Manufacturing data
The data for all stone products were collected from NSI members covering a period of two years, from January 2019 to December 2020. Data for quarry operations were collected from twelve NSI quarry members covering 36 quarries across North America. The participant quarries in this study are Coldspring, Delgado Stone Distributors, Freshwater Stone, Independent Limestone Company, Polycor, Quality Stone Corporation, Royal Bedrock Inc., Russell Stone Products, Stony Creek Quarry, Vermont Quarries Corporation, and Vetter Stone Company.
After the stone is extracted from the quarry, it goes to a processing facility. Stone processor operations data were collected from six NSI member processors covering 17 facilities across North America. The participant processors in this study are Delgado Stone Distributors, Polycor, Russell Stone Products, Vetter Stone Company, and Continental Cut Stone.
Countertops require additional manufacturing operations at fabricators. Fabricator operations data were collected from six NSI member fabricators in the US, each with a single facility. The participant fabricators in this study are Cutting Edge Countertops, Freshwater Stone, Ontra Stone Concepts, Planet Granite, Stone Interiors, and Valley View Granite. NSI resources and other literature data were used to develop estimates or assumptions for other upstream or downstream activities where necessary.
Industry-wide results calculation methodology
Based on the data provided by the participating natural stone countertop fabricators, granite represented 93.56% of natural stone countertops in the market. Marble countertops covered 3.69% of the market share, while the rest (2.75%) was from other natural stones (including quartzite and soapstone).
For quarry data, an average inventory per kg of stone quarried for each stone category (granite, limestone, marble, and other natural stone) was developed, and later a weighted inventory per kg of stone quarried was generated using the quarry production share of each stone type among the participant quarries. After that, the inventory per kg of stone quarrying specific to stone countertops was developed using the market distribution of natural stone countertops by stone type, as collected from participant stone processing facilities (93.56% granite, 3.69% marble, and 2.75% other natural stone).
Similarly, the inventory for one square meter of processed stone countertops was developed. An average inventory per square meter of stone processed for each stone category (granite, limestone, marble, and other natural stone) was developed, and later a weighted inventory per square meter of stone processed was generated using the production share of each stone type, using the stone processing share of each stone type among the participant processors. After that, the inventory per square meter of stone processing specific to countertops was developed using the market distribution of natural stone countertops (93.56% granite, 3.69% marble, and 2.75% other natural stone). Processing countertops uses more energy than processing other products, so to reflect this, the inventory for countertop stone processing was scaled up by 10%.
In the case of countertop fabricators, inputs and outputs were normalized using total production area to develop the inventory for a square meter of countertop fabrication.
What’s causing the greatest impacts
All life cycle stages
For natural stone countertops, the cradle-to-gate stage (A1-A3) dominates the results for all impact categories. This is mainly due to energy consumption in the quarrying and construction stages. The manufacturing stage (A3) is the highest contributor to all impact categories, followed by quarry operations (A1) in all impact categories but ozone depletion. In total, the stages in A1-A3 contribute about 65% of the total impacts in all impact categories. The transportation of stone between the facilities (A2) and final shipment to the installation sites (A4) also makes a significant impact.
The overall results are consistent with expectations for stone countertop products’ life cycles, as these products are not associated with energy consumption during their use stage.
Quarry operations and transport to processors
Impacts generated at quarries (A1) are mainly due to the use of grid electricity and fuels in the quarries. Other material inputs generate little impact in comparison to the electricity and fuel consumed. Transporting the stone from quarries to processing plants also generates significant impacts in numerous impact categories.
Construction and transport to building sites
Manufacturing operations at processing facilities and fabricator sites make up the greatest share of total life cycle impacts in all impact categories. Energy consumed at the construction sites, including both processors and fabricators, is responsible for the majority of impacts, while other material inputs have little contribution. Transporting countertops from fabricators includes not only the shipment of countertops to the building sites, but also the initial visit for site measurements, which also makes significant contributions to overall impacts.
Other life cycle stages
Use of ancillary materials, including adhesives and various sealants during installation, also generates significant impacts in the overall life cycle of stone countertops. Under normal operating conditions, stone countertops require weekly cleaning, and non-granite countertops additionally need resealing every five years. Impacts during the use stage are driven by the use of silicone-based sealants for resealing.
Due to the nature of natural stone, it is anticipated that the stone countertops will last for a service life of 10 years. End-of-life stages have lower contributions on the total life cycle impacts.
Variation analysis
A variation analysis was performed to study the environmental impacts variations between natural stone countertops from different stone types. Results were generated for both quarry operations and the construction stage, specific to various stone types based on the production share of different quarries, processors, and fabricators for each stone type. One of the major parameters that influences the results is the amount of stone that needs to be quarried to produce 1 m2 of stone countertops, which varies per stone type.
The variation between weighted average, minimum, and maximum LCIA results is greater than 20% for all the impact categories. This is due to varying quarry and construction operations used by different quarries and processors.
Sensitivity analysis
Based on NSI's expert judgement, it was assumed that the energy consumed for processing one square meter of stone countertops makes up about 10% of the average energy consumed for processing different stone products. A sensitivity analysis was performed to check the robustness of the results when energy consumed is changed by +/-20% of the estimate used in this study. The resulting variation in the total life cycle impacts was less than 10% and is considered to be insignificant.
How we're making it greener
The natural stone industry is committed to making sure our inherently eco-friendly building material is produced efficiently and responsibly. Through the Natural Stone Sustainability Standard, we have defined metrics for responsible production in the following categories:
- Energy
- Water
- Chemicals
- Land reclamation & adaptive reuse
- Site management
- Transportation
- Social governance
- Human health & safety
- Excess process materials
- Solid waste
- Innovation
Companies have the opportunity to third-party verify compliance with these metrics. As the industry’s leader in education, the Natural Stone Institute is also striving to build awareness around best practices for sustainability among all quarriers and fabricators globally.
LCA results
| Life cycle stage | Material acquisition and pre-processing | Construction | Installation | Use and maintenance | End-of-life |
|
Information modules: Included | |
A1 Quarry operations | A3 Construction | A4 Transport to building sites | B2 Maintenance | C2 Waste transport |
| A2 Transport to processors | A5 Installation | C4 Disposal | |||
 |
 |
 |
 |
SM Single Score
Learn about SM Single Score results| Impacts of 1 square meter of natural stone countertop | 1.38E+00 mPts | 4.38E+00 mPts | 8.15E-01 mPts | 2.08E-01 mPts | 2.09E-02 mPts |
| Materials or processes contributing >20% to total impacts in each life cycle stage | Energy consumed during stone quarrying (electricity and fuels). | Energy consumed during stone processing and fabrication (electricity and fuels). | Use of ancillary materials (adhesives) for installation and transport of product to building site. | Material consumed for maintenance. | Waste transport to end-of-life centers. |
TRACI v2.1 results per functional unit
| Life cycle stage | Material acquisition and pre-processing | Construction | Installation | Use and maintenance | End-of-life |
Ecological damage
Human health damage
Additional environmental information
| Impact category | Unit | |||||
| Fossil fuel depletion | MJ surplus Mega Joule, lower heating value Fossil fuel depletion is the surplus energy to extract minerals and fossil fuels. |
1.80E+01 | 5.55E+01 | 2.09E+01 | 4.13E+00 | 9.74E-01 |
| Ecotoxicity | CTUe Comparative Toxic Units of Ecotoxicity Ecotoxicity causes negative impacts to ecological receptors and, indirectly, to human receptors through the impacts to the ecosystem. |
1.85E+01 | 3.25E+01 | 1.43E+01 | 3.61E+00 | 2.27E-01 |
References
LCA Background Report
NSI Natural Stone Countertops LCA Background Report (public version), NSI 2022. SimaPro Analyst 9.4, ecoinvent 3.4 database.
ISO 21930:2017 serves as the core PCR along with EN 15804 & UL Environment Part A.
NSF's PCR for residential countertops
PCR review conducted by Evan Griffing, Ph.D.; Thomas P. Gloria, Ph.D.; and Jack Geibig.
ISO 14025, “Sustainability in buildings and civil engineering works -- Core rules for environmental product declarations of construction products and services”, ISO21930:2017
Download PDF SM Transparency Report, which includes the additional EPD content required by the NSF PCR.
SM Transparency Reports (TR) are ISO 14025 Type III environmental declarations (EPD) that enable purchasers and users to compare the potential environmental performance of products on a life cycle basis. This EPD was not written to support comparative assertions. Even for similar products, differences in functional unit, use and end-of-life stage assumptions, and data quality may produce incomparable results. It is not recommended to compare EPDs with another organization as there may be differences in methodology, assumptions, allocation methods, data quality such as variability in datasets, and results of variability in assessment software tools used. A limitation to this study is that not all manufacturers in North America participated. TRs/EPDs of products that conform to the same PCR and include the same life cycle stages, but are made by different manufacturers, may not sufficiently align to support direct comparisons. They therefore, cannot be used as comparative assertions unless the conditions defined in ISO 14025 Section 6.7.2. ‘Requirements for Comparability’ are satisfied.