LCA results & interpretation Thermo-Lag Series
Scope and summary
- Cradle to gate
- Cradle to gate with options
- Cradle to grave
Product description
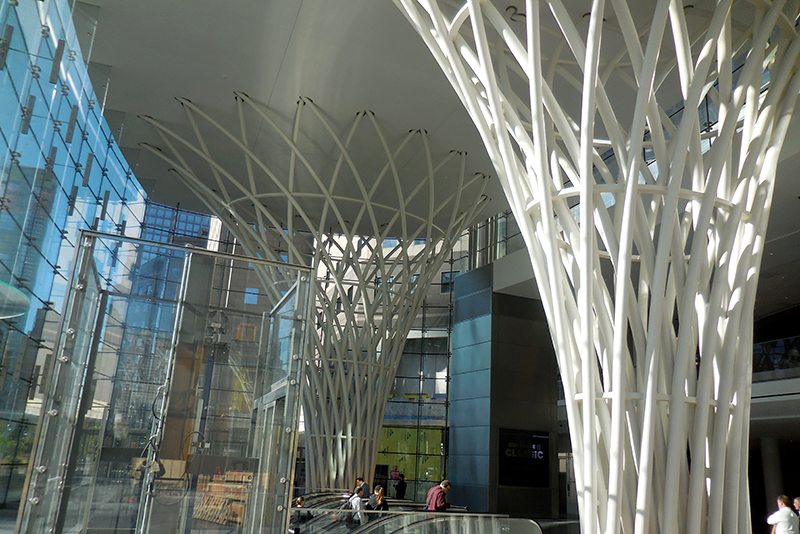
Carboline’s Thermo-Lag series includes four products: Thermo-Lag E100, Thermo-Lag E100-S, Thermo-Lag 3000, and Thermo-Lag 3000-SP. Thermo-Lag products are two-component epoxy-based thin-film, intumescent coating products for structural steel. They allow the designer to express the structure as an artform in buildings where fire resistance ratings are required. In a fire, they soften and expand to form thick meringue-like layers, which insulate the structure and protect the steel from fire.
Functional unit
The functional unit is one square meter of covered and protected substrate for a period of 60 years (the assumed average lifetime of a building).
Application and maintenance: Since Thermo-Lag products fall under the primer designation and are applied to interior architecture, a 5-year market-based lifetime was adopted in the LCA models. One initial coating application and 11 recoats are required because the average life span of a building is assumed to be 60 years. The preferred waste management option for leftover paint is 100% incinerated.
Colorant: Colorants are not added to the fireproofing coatings themselves, neither at the point of sale nor at the point of application as defined in the application manuals and are therefore not included in the scope of this study.
Manufacturing data
Time coverage: The data covers annual manufacturing data for the 2021 calendar year from Carboline’s manufacturing plant in Dayton, Nevada. This period of time was chosen in order to capture a representative picture of businesses activities at Carboline.
Geographical coverage: The geographical coverage for this study is based on United States system boundaries for all processes and products.
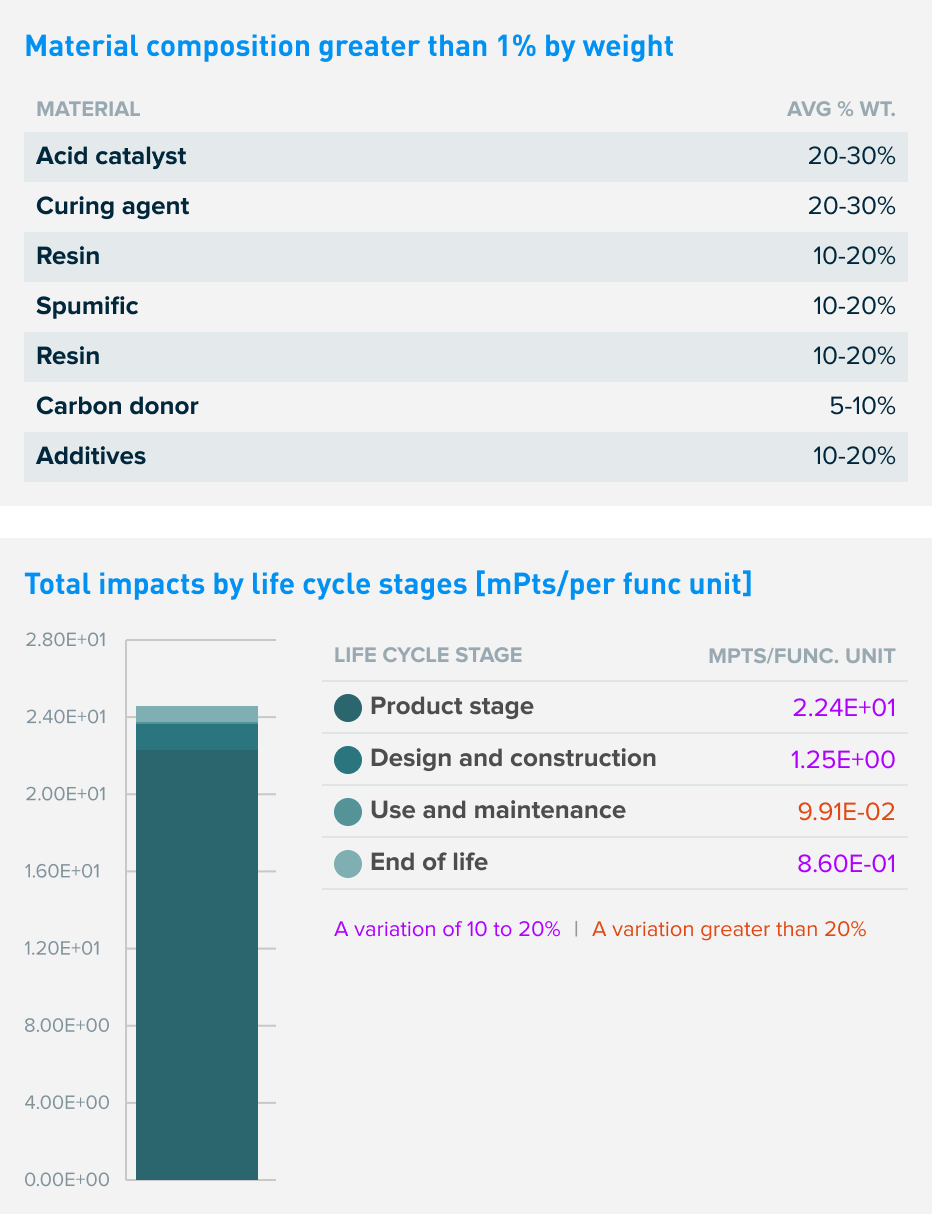
What’s causing the greatest impacts
All life cycle stages
The product stage (Stage 1) accounts for the highest contribution to impacts, primarily because of the impacts associated with raw material manufacturing. The design and construction stage (Stage 2) is the next highest contributor for all impact categories except for global warming, smog, eutrophication, and carcinogenics. The use and maintenance stage (Stage 3) accounts for a minimum contribution to almost all impact categories due to the low energy required for spray application.
Product stage
The raw material manufacturing phase (1-1) is the largest contributor to all impact categories. This holds true for the LCA results of each of Carboline’s Thermo-Lag products. Raw material manufacturing accounts for over 50% of the impact in each category for most of the products. Thermo-Lag 3000-SP is the only exception; however, raw material manufacturing still contributes ~45% to smog and ~48% to ecotoxicity impact categories.
Design and construction
The design and construction stage (Stage 2) is the next highest contributor to most of the impact categories, including ozone depletion, acidification, non carcinogenics, respiratory effects, ecotoxicity, and fossil fuel depletion. For the Thermo-Lag series, stage 2 contributes over 20% to total ozone depletion. The contributions to transportation are caused by the use of truck and trailer transportation.
Use and maintenance
It's worth noting that the VOC emissions released in the drying phase (phase 3-2) affect the variability in potential smog formation impacts. According to the product data sheets, Thermo-Lag E 100-S and Thermo-Lag 3000-SP release more VOCs during the drying process than the other two products. This results in phase 3-2 having a greater contribution to smog formation (over 30%) for Thermo-Lag E 100-S and Thermo-Lag 3000-SP.
End of life
For the Thermo-Lag series, the second highest impact to the global warming, eutrophication, and carcinogenics categories comes from the end-of-life stage (Stage 4).
Sensitivity analysis
A sensitivity analysis was performed to check the robustness of the results when the mass of specified raw materials was changed by +/-20%. These raw materials were chosen based on a combination of relatively higher contribution to the results.
Global warming potential was evaluated for sensitivity since Carboline is interested in the potential CO2-equivalent emissions of its products. The resulting variation in the total life cycle impacts is less than 10%, implying that the system is not sensitive to this assumed value.
How we're making it greener
Carboline is committed to finding new and efficient alternatives in manufacturing, raw material sourcing, and logistics to improve sustainability efforts. One of Carboline’s most impactful contributions is the creation of the SLOB Program (slow moving and obsolete inventory). To reduce hazardous waste generation, the SLOB Program was designed to provide optics to Carboline’s Inventory Analytics Team to review inventory close to expiration. Preventative measures are taken to rework inventory or sell this material at a discounted rate, with the ultimate goal of preventing little to zero waste of unused material. As an RPM company, Carboline is dedicated to working towards reaching the goals that have been set through RPM’s Building a Better World Program. These goals include reducing energy consumption, landfill contributions, and water reuse/conservation opportunities.
LCA results
| Life cycle stage | stage 1 Product stage |
stage 2 Design and construction |
stage 3 Use and maintenance |
stage 4 End of life |
|
Information modules: Included (X) |
|
1-1 Raw material manufacturing | 2-1 Transportation to distribution center | 3-1 Coating application | 4-1 Transportation to disposal site |
| 1-2 Transportation of raw materials to plants | 2-2 Transportation to point of sale | 3-2 Emissions from drying | 4-2 End-of-life management | |
| 1-3 Coating manufacturing | 2-3 Transportation to application site | 3-3 Necessary maintenance and repaints | ||
 |
 |
 |
 |
SM Single Score
Learn about SM Single Score results| Impacts of the coating used for covering 1 square meter of substrate | 2.24E+01 mPts | 1.25E+00 mPts | 9.91E-02 mPts | 8.60E-01 mPts |
| Materials or processes contributing >20% to total impacts in each life cycle stage | Energy used for raw material extraction (electricity and fuels). | Trucks and trailer transportation (fuel consumption). | Energy and electricity consumed for coating application and recoats. | Incineration of the waste coating. |
Thermo-Lag E100: TRACI v2.1 results per functional unit
| Life cycle stage | stage 1 Product stage |
stage 2 Design and construction |
stage 3 Use and maintenance |
stage 4 End of life |
Ecological damage
Human health damage
Additional environmental information
| Impact category | Unit | ||||
| Fossil fuel depletion | MJ surplus Mega Joule, lower heating value Fossil fuel depletion is the surplus energy to extract minerals and fossil fuels. |
3.04E+02 | 4.51E+01 | 1.24E-01 | 4.84E-01 |
| Ecotoxicity | CTUe Comparative Toxic Units of Ecotoxicity Ecotoxicity causes negative impacts to ecological receptors and, indirectly, to human receptors through the impacts to the ecosystem. |
2.30E+02 | 6.04E+01 | 7.08E-03 | 8.49E+00 |
Thermo-Lag E100-S: TRACI v2.1 results per functional unit
| Life cycle stage | stage 1 Product stage |
stage 2 Design and construction |
stage 3 Use and maintenance |
stage 4 End of life |
Ecological damage
Human health damage
Additional environmental information
| Impact category | Unit | ||||
| Fossil fuel depletion | MJ surplus Mega Joule, lower heating value Fossil fuel depletion is the surplus energy to extract minerals and fossil fuels. |
2.52E+02 | 3.44E+01 | 9.84E-02 | 3.80E-01 |
| Ecotoxicity | CTUe Comparative Toxic Units of Ecotoxicity Ecotoxicity causes negative impacts to ecological receptors and, indirectly, to human receptors through the impacts to the ecosystem. |
1.86E+02 | 4.60E+01 | 5.62E-03 | 6.54E+00 |
Thermo-Lag 3000: TRACI v2.1 results per functional unit
| Life cycle stage | stage 1 Product stage |
stage 2 Design and construction |
stage 3 Use and maintenance |
stage 4 End of life |
Ecological damage
Human health damage
Additional environmental information
| Impact category | Unit | ||||
| Fossil fuel depletion | MJ surplus Mega Joule, lower heating value Fossil fuel depletion is the surplus energy to extract minerals and fossil fuels. |
3.15E+02 | 4.57E+01 | 1.23E-01 | 4.82E-01 |
| Ecotoxicity | CTUe Comparative Toxic Units of Ecotoxicity Ecotoxicity causes negative impacts to ecological receptors and, indirectly, to human receptors through the impacts to the ecosystem. |
2.44E+02 | 6.12E+01 | 7.06E-03 | 8.47E+00 |
Thermo-Lag 3000-SP: TRACI v2.1 results per functional unit
| Life cycle stage | stage 1 Product stage |
stage 2 Design and construction |
stage 3 Use and maintenance |
stage 4 End of life |
Ecological damage
Human health damage
Additional environmental information
| Impact category | Unit | ||||
| Fossil fuel depletion | MJ surplus Mega Joule, lower heating value Fossil fuel depletion is the surplus energy to extract minerals and fossil fuels. |
2.57E+02 | 3.80E+01 | 9.86E-02 | 3.87E-01 |
| Ecotoxicity | CTUe Comparative Toxic Units of Ecotoxicity Ecotoxicity causes negative impacts to ecological receptors and, indirectly, to human receptors through the impacts to the ecosystem. |
2.20E+02 | 5.09E+01 | 5.63E-03 | 6.66E+00 |
References
LCA Background Report
Carboline Intumescent fireproofing coating LCA Background Report (public version), Carboline 2022; SimaPro Analyst 9.4; Ecoinvent 3.4 and US ecoinvent (US -EI 2.2) database; TRACI 2.1
PCRs
PCR for Architectural Coatings: NAICS 325510
Valid through Feb. 29, 2023. PCR review conducted by Thomas P. Gloria (Industrial Ecology Consultants), Ph. D; Mr. Bill Stough (Sustainable Research Group); Dr. Michael Overcash (Environmental Clarity).
NSF Program Operator Instructions
ISO 14025, “Sustainability in buildings and civil engineering works -- Core rules for environmental product declarations of construction products and services”

Download PDF SM Transparency Report, which includes the additional EPD content required by the NSF PCR.
SM Transparency Reports (TR) are ISO 14025 Type III environmental declarations (EPD) that enable purchasers and users to compare the potential environmental performance of products on a life cycle basis. Environmental declarations from different programs (ISO 14025) may not be comparable. In order to support comparative assertions, this EPD meets all comparability requirements stated in ISO 14025:2006. However, differences in certain assumptions, data quality, and variability between LCA data sets may still exist. As such, caution should be exercised when evaluating EPDs from different manufacturers, as the EPD results may not be entirely comparable. Any EPD comparison must be carried out at the building level per ISO 21930 guidelines. The results of this EPD reflect an average performance by the product and its actual impacts may vary on a case-to-case basis.
 SM Transparency Report (EPD)