LCA & material health results & interpretation SANCTUARY® Loose-Fill or Spray-Applied Insulation by Greenfiber®
Scope and summary
- Cradle to gate
- Cradle to gate with options
- Cradle to grave
Application
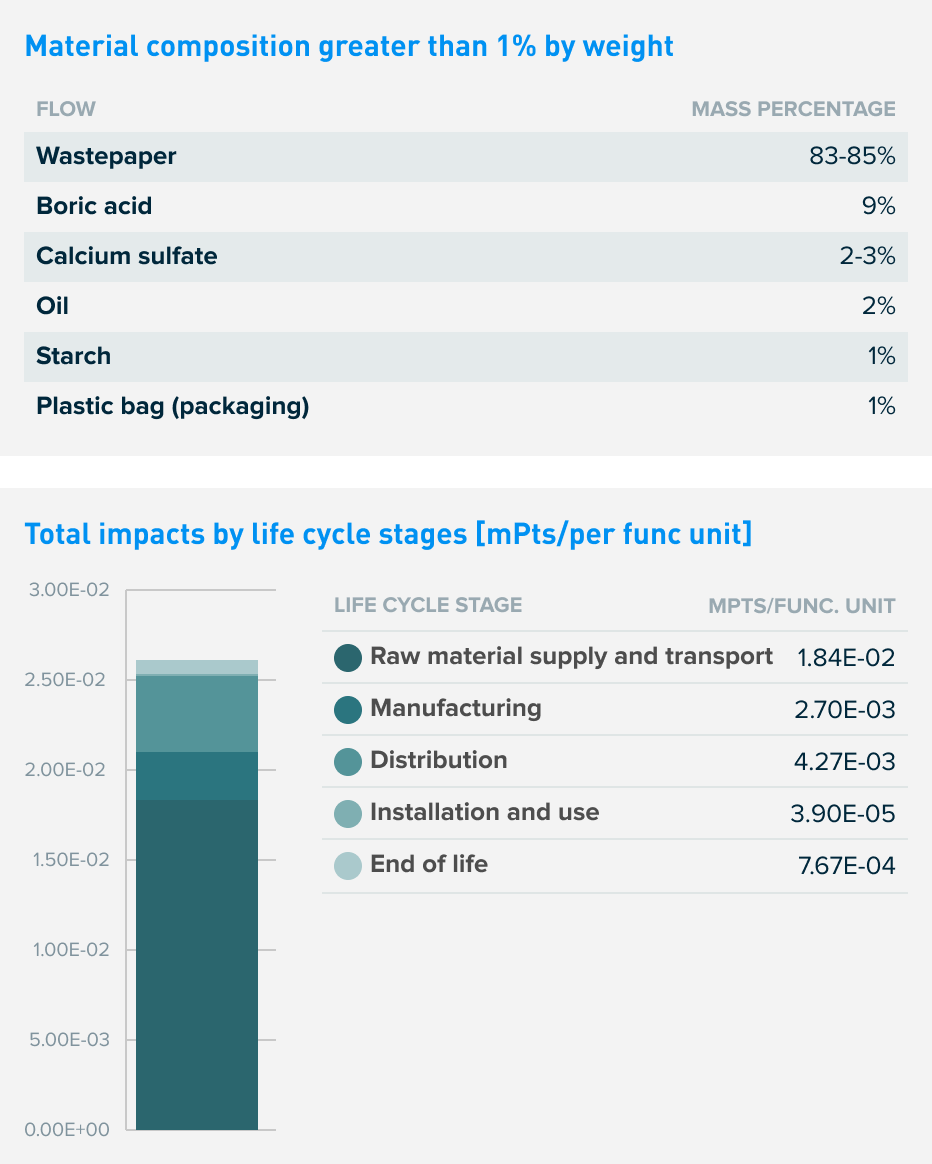
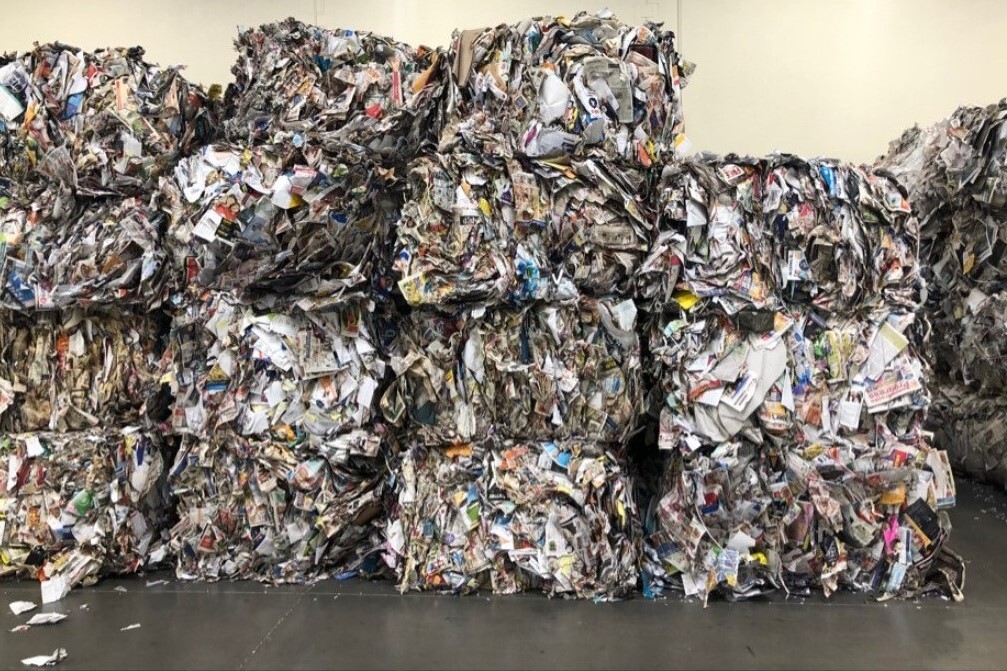
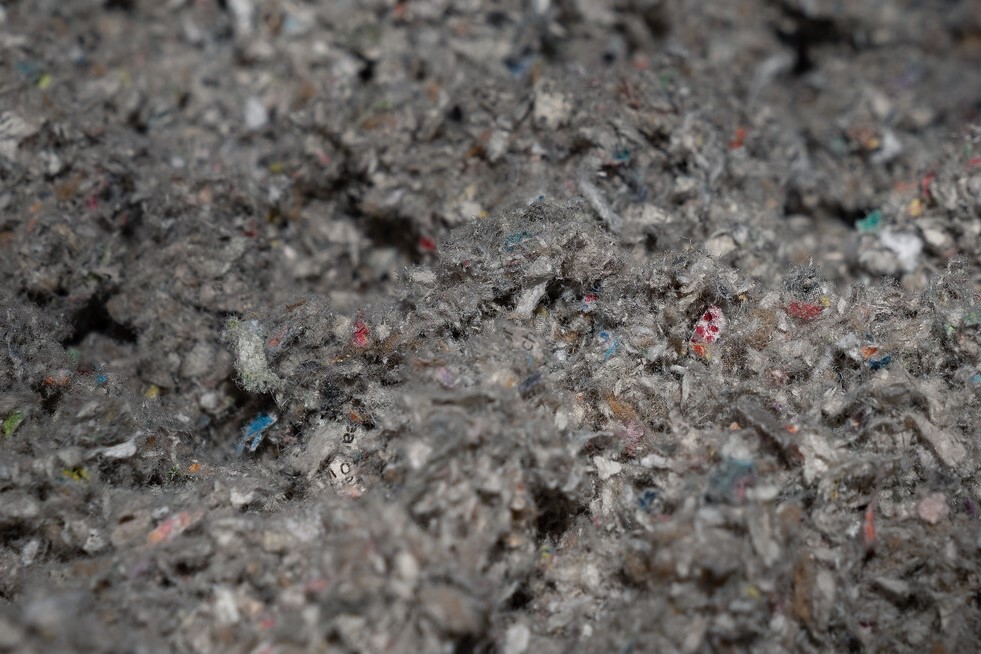
SANCTUARY is insulation primarily made of postconsumer paper and can be either blown-in or spray-applied in attics, walls, floors, and ceilings. This fiber insulation is suitable for all climates and conditions. SANCTUARY is engineered to fill tiny crevices and gaps, creating a dense, advanced barrier capable of reducing the power of sound and also heating and cooling costs. It can be easily filled over existing insulation and is designed to fill every gap, void, and hard-to-reach place without time consuming cutting and fitting.
Functional unit
Reference service life: 75 years. One square meter of installed insulation material, packaging included, with a thickness that gives an average thermal resistance of RSI=1m2·K/W over a period of 75 years.
Reference flow: 0.653 kg
Thickness: 0.0378 m
Density: 17.1 kg/m3
Manufacturing data
Reporting period: January--December, 2021
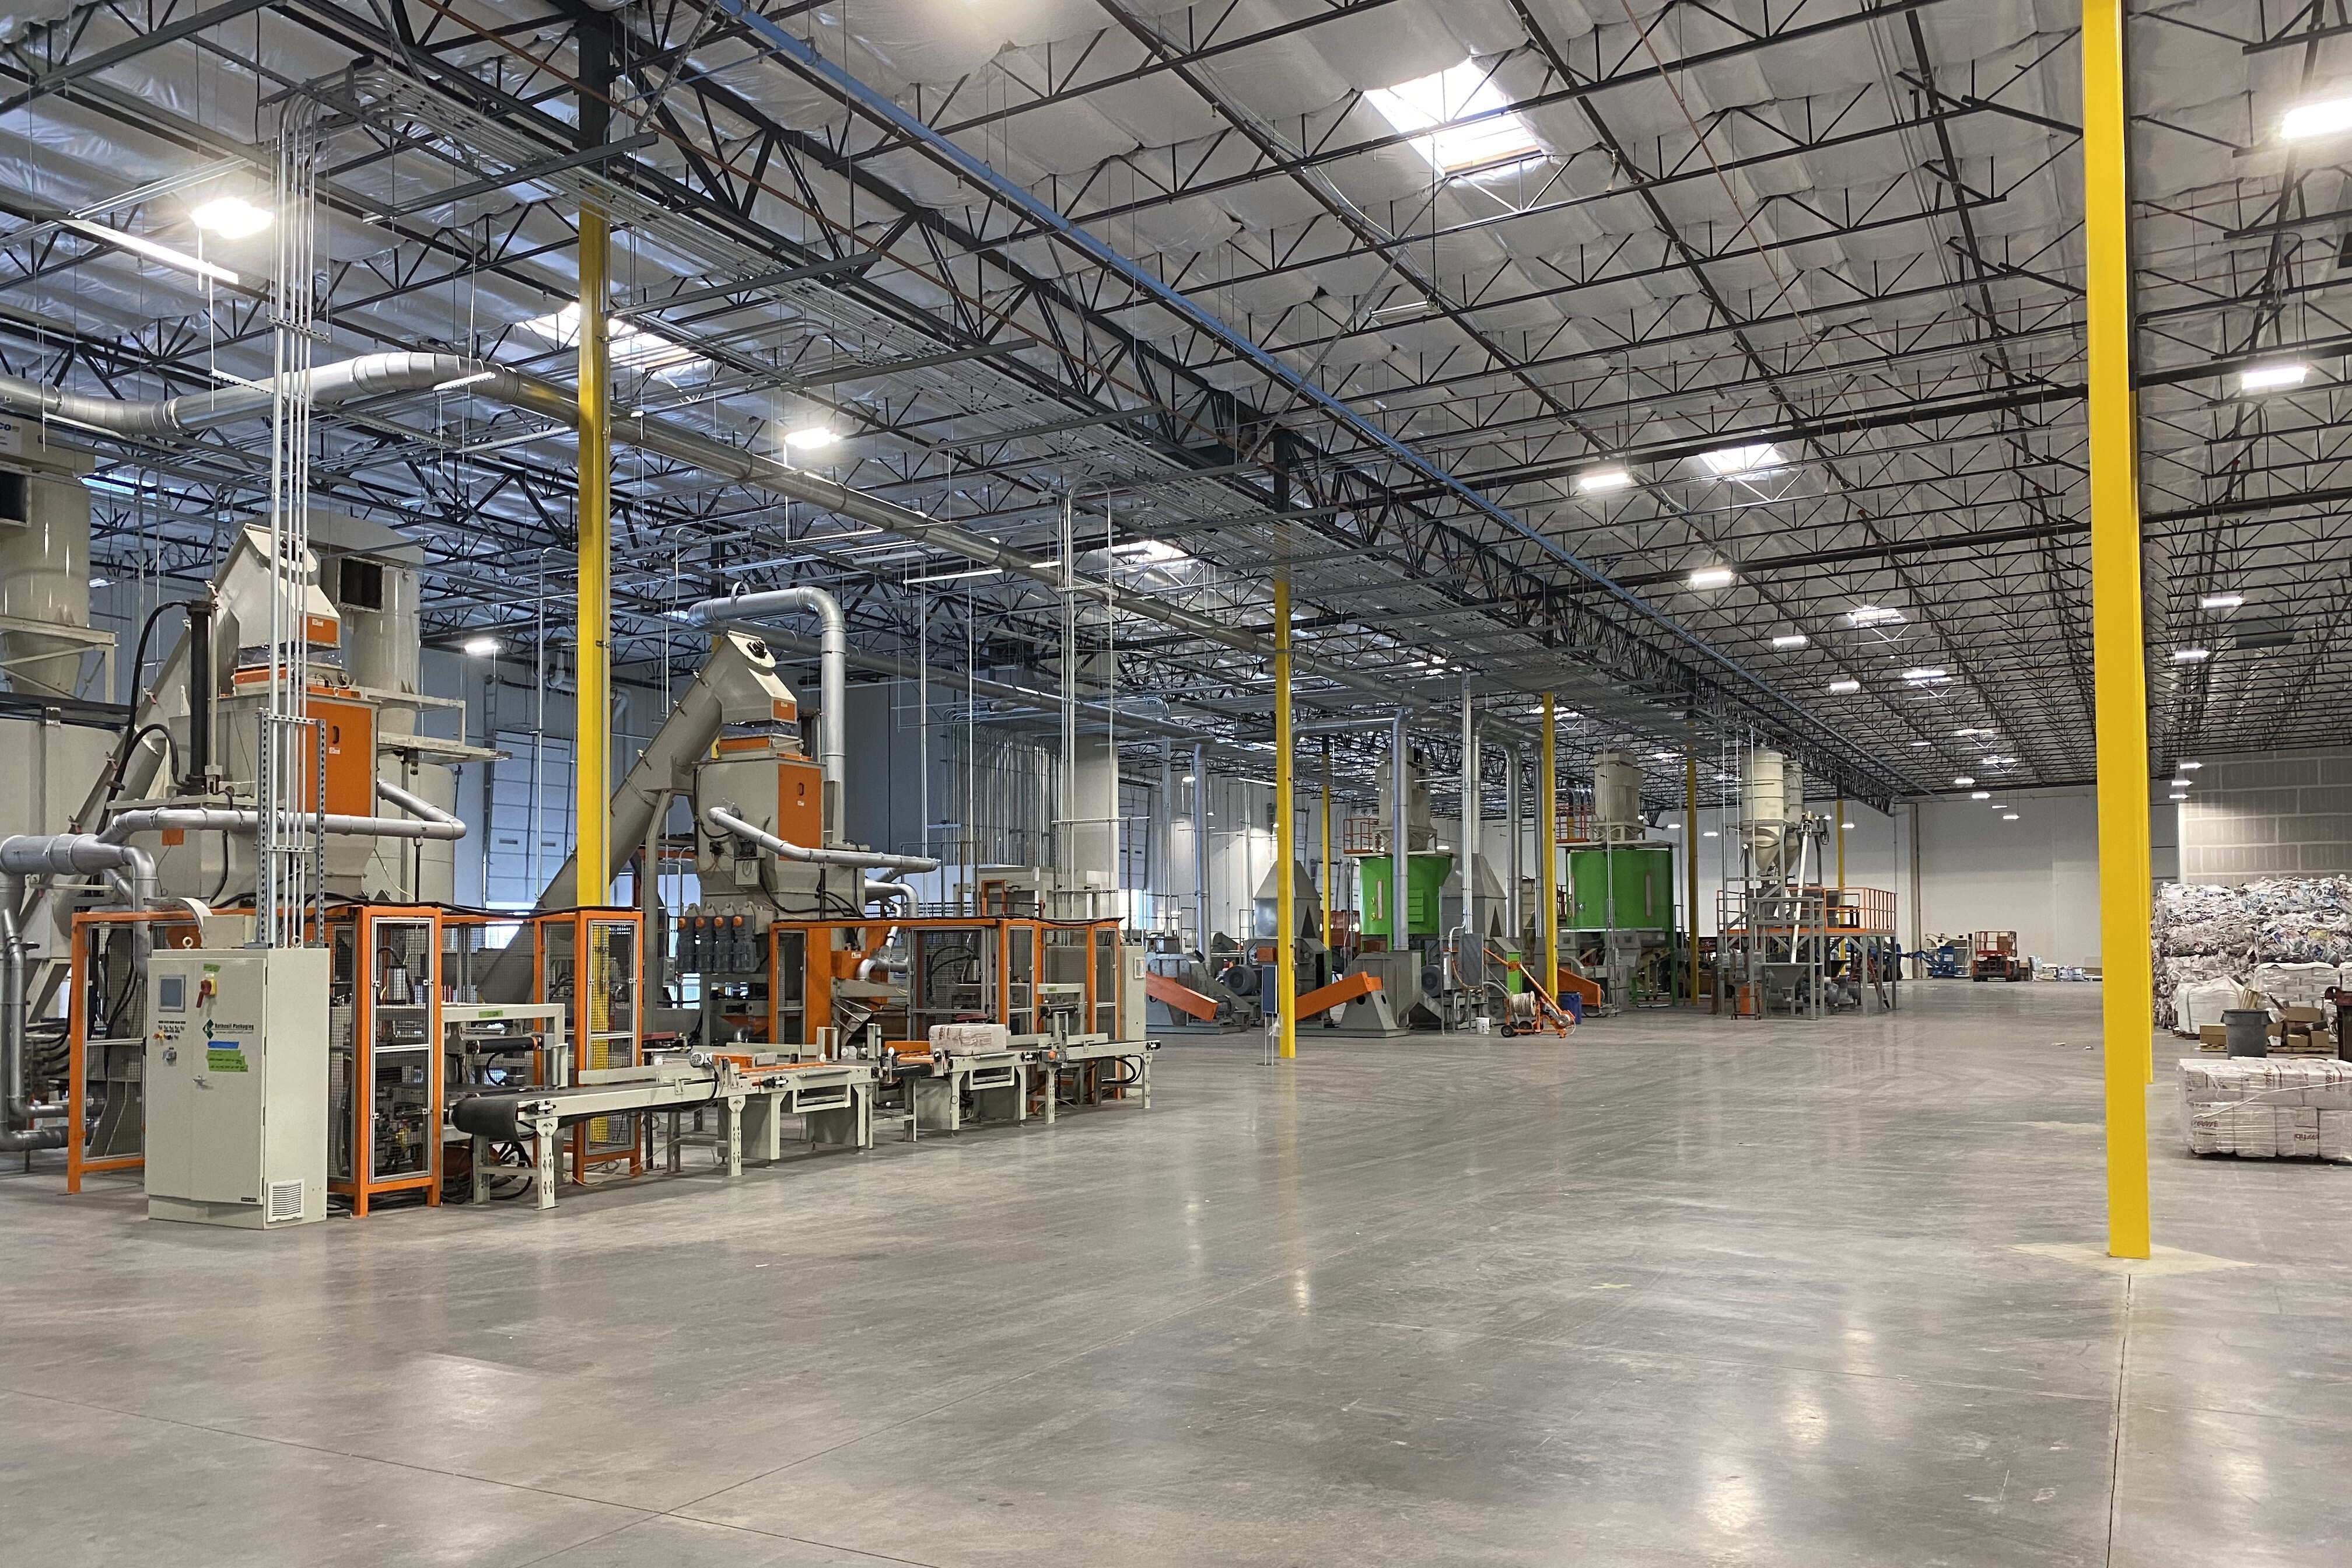
Representing six locations across the US: Mesa, AZ; Norfolk, NE; Salt Lake City, UT; Tampa, FL; Waco, TX; and Wilkes-Barre, PA. After raw materials are transported to the facilities, incoming wastepaper is shredded and placed into a fiber handling system, which is then moved to the finish mills, where the final grind is conducted and the dry fire-retardant chemicals and then a liquid fire retardant are added. That product is moved to the packaging subsystem, which hydraulically compresses the insulation into its final packaging. Each facility has a dust collection system which traps the dust from the wastepaper processing and is later sent for recycling along with production scrap.
Default installation, packaging, and disposal scenarios
At the installation site, insulation products are delivered in 25lb bags, unpackaged, and installed with a blowing machine, assumed to consume 0.003 kWh of electricity during the installation of one square meter. The disposal of packaging waste is modeled using US EPA’s landfilling rate of 37.1% and recycling rate of 53.9%. No maintenance or replacement is required to achieve the product's life span. After removal, the insulation is assumed to be landfilled.

Data quality
Primary data was collected for a time period of one year, which represents typical operations of Applegate-Greenfiber facilities. Inventory data is considered to have a good precision and provide a representative depiction of the facilities. Data is also considered to be complete, as no know flows are deliberately excluded from this analysis other than those defined to be outside of the system boundary.
What’s causing the greatest impacts
All life cycle stages
For SANCTUARY insulation, the cradle-to-gate stage (A1-A3) dominates the results for most categories. This study assessed a multitude of inventory and environmental indicators. In addition to the six major impact categories (global warming potential, ozone depletion, acidification, smog, eutrophication, and fossil fuel depletion), additional impact categories have also been included. These six impact categories are globally deemed mature enough to be included in Type III environmental declarations. Other categories are being developed and defined, and LCA should continue making advances in their development. However, the EPD users shall not use additional measures for comparative purposes. LCIA results are relative expressions and do not predict impacts on category endpoints, the exceeding of thresholds, safety margins or risks.
Overall results are consistent with expectations for SANCTUARY's life cycle, with most of the impacts being generated during cradle-to-gate stages, as insulation is not associated with energy consumption during its installation, use, or disposal stages.
Raw materials acquisition and manufacturing
The primary finding, across the environmental indicators and for the product considered, was that cradle-to-gate impacts contribute the most impacts to most categories. This is mostly driven by the extraction of incoming raw materials (A1) and electricity consumed during manufacturing (A3). Boric acid and oil use are the raw materials that contribute to higher environmental impacts than the others. No substances required to be reported as hazardous are associated with the production of this product.
Transportation
Following the cradle-to-gate stage, the next highest impacts come from the distribution (A4) stage. The impacts associated with outbound transport are comparatively higher than that for inbound due to the further transportation distances.
Installation
Installation accounts for a small fraction of overall life cycle impacts. The only installation impacts are associated with packaging disposal and the energy used for an installation blower machine. No ancillary materials are needed for installation.
End of life
At the end of life, insulation is removed from the building and landfilled. For all products, waste was dominated by the final disposal of the product. Non-hazardous waste also accounts for waste generated during manufacturing and installation. No hazardous waste is created.
Sensitivity analysis
The electricity consumed during production drives the overall impacts in each impact category. Since the manufacturing stage is one of the major contributors to life cycle impacts, a sensitivity analysis was performed to check the robustness of the results when the energy consumed is varied by ±20%. The resulting variation in the total life cycle impacts is less than 10%, implying that the system is not sensitive to this assumed value.
Scaling factors
Scaling factors can be used to determine the impacts of each R-value of SANCTUARY Insulation based on different applications (loose and stabilized, dense pack, or spray-filled application). Loose-fill cellulose insulation is typically applied to enclosed areas, unfinished attic floors, and other hard to reach places, so the results per functional unit are presented for a loose-filled and stabilized application at RSI=1 m2.K/W. The scaling factors are based on the mass and thickness of SANCTUARY and can be used to determine the impacts for each R-value when multiplied by the functional unit. See the scaling factors on Page 4 >
How we're making it greener
SANCTUARY® Cellulose Insulation is made from living trees that lock in carbon for the life of the product. Couple this with low-energy manufacturing and short-haul transportation, and it’s clear why cellulose insulation is the responsible choice for homeowners and the planet. Selecting low-carbon building material options can dramatically reduce emissions while providing the same level of building performance, or higher. As insulation levels in buildings increase to meet higher energy efficiency requirements, choosing insulation products based on their embodied carbon is crucial. Since cellulose insulation is derived from trees, it sequesters carbon in the walls and ceilings of homes, a feature not seen in other types of insulation products that are commercially available.
LCA results
| Life cycle stage | Raw material supply and transport | Manufacturing | Distribution | Installation | Use | End of life |
|
Information modules: |
A1 Raw material extraction | A3 Manufacturing operations | A4 Transport to building sites | A5 Installation | B1 Use | C1 Deconstruction |
| A2 Transport to facilities | B2 Maintenance | C2 Waste transport | ||||
| B3 Repair | C3 Waste processing | |||||
| B4 Replacements | C4 Disposal | |||||
| B5 Refurbishment | ||||||
| B6 Operational energy use | ||||||
| B7 Operational water use | ||||||
 |
 |
 |
 |
 |
SM Single Score
Learn about SM Single Score results| Impacts per functional unit: weighted average of all plants | 1.84E-02 mPts | 2.70E-03 mPts | 4.277E-03 mPts | 3.90E-05 mPts | 0 mPts | 7.67E-04 mPts |
| Materials or processes contributing >20% to total impacts in each life cycle stage | Extraction of raw materials, especially boric acid and oil. | Electricity required to operate the manufacturing process. | Truck transportation for distribution of the product. | Electricity consumed by the blower during insulation. | No activities contributing to impacts in the use stage. | Truck transportation to the disposal site, and final waste landfill. |
Mesa, AZ - TRACI v2.1 results per functional unit
| Life cycle stage | A1-A2 RM supply & transport | A3 Manufacturing |
A4 Distribution |
A5 Installation |
B1-B7 Use |
C1-C4 End of life |
Ecological damage
Human health damage
Additional environmental information
| Impact category | Unit | ||||||
| Fossil fuel depletion | MJ surplus Mega Joule, lower heating value Fossil fuel depletion is the surplus energy to extract minerals and fossil fuels. |
4.97E-01 | 1.12E-01 | 1.13E-01 | 1.03E-03 | 0 | 2.79E-02 |
| Ecotoxicity | CTUe Comparative Toxic Units of Ecotoxicity Ecotoxicity causes negative impacts to ecological receptors and, indirectly, to human receptors through the impacts to the ecosystem. |
73.7 % | 1.0 % | 21.4 % | 0.1 % | 0 % | 3.8 % |
Norfolk, NE - TRACI v2.1 results per functional unit
| Life cycle stage | A1-A2 RM supply & transport | A3 Manufacturing |
A4 Distribution |
A5 Installation |
B1-B7 Use |
C1-C4 End of life |
Ecological damage
Human health damage
Additional environmental information
| Impact category | Unit | ||||||
| Fossil fuel depletion | MJ surplus Mega Joule, lower heating value Fossil fuel depletion is the surplus energy to extract minerals and fossil fuels. |
4.65E-01 | 8.96E-02 | 1.44E-01 | 1.02E-03 | 0 | 2.77E-02 |
| Ecotoxicity | CTUe Comparative Toxic Units of Ecotoxicity Ecotoxicity causes negative impacts to ecological receptors and, indirectly, to human receptors through the impacts to the ecosystem. |
67.8 % | 1.5 % | 26.9 % | 0.1 % | 0 % | 3.7 % |
Salt Lake City, UT - TRACI v2.1 results per functional unit
| Life cycle stage | A1-A2 RM supply & transport | A3 Manufacturing |
A4 Distribution |
A5 Installation |
B1-B7 Use |
C1-C4 End of life |
Ecological damage
Human health damage
Additional environmental information
| Impact category | Unit | ||||||
| Fossil fuel depletion | MJ surplus Mega Joule, lower heating value Fossil fuel depletion is the surplus energy to extract minerals and fossil fuels. |
3.26E-01 | 7.32E-02 | 2.16E-01 | 1.02E-03 | 0 | 2.77E-02 |
| Ecotoxicity | CTUe Comparative Toxic Units of Ecotoxicity Ecotoxicity causes negative impacts to ecological receptors and, indirectly, to human receptors through the impacts to the ecosystem. |
55.4 % | 0.6 % | 40.2 % | 0.1 % | 0 % | 3.7 % |
Tampa, FL - TRACI v2.1 results per functional unit
| Life cycle stage | A1-A2 RM supply & transport | A3 Manufacturing |
A4 Distribution |
A5 Installation |
B1-B7 Use |
C1-C4 End of life |
Ecological damage
Human health damage
Additional environmental information
| Impact category | Unit | ||||||
| Fossil fuel depletion | MJ surplus Mega Joule, lower heating value Fossil fuel depletion is the surplus energy to extract minerals and fossil fuels. |
3.58E-01 | 2.45E-01 | 1.48E-01 | 1.03E-03 | 0 | 2.79E-02 |
| Ecotoxicity | CTUe Comparative Toxic Units of Ecotoxicity Ecotoxicity causes negative impacts to ecological receptors and, indirectly, to human receptors through the impacts to the ecosystem. |
65.9 % | 0.9 % | 29.2 % | 0.1 % | 0 % | 4.0 % |
Waco, TX - TRACI v2.1 results per functional unit
| Life cycle stage | A1-A2 RM supply & transport | A3 Manufacturing |
A4 Distribution |
A5 Installation |
B1-B7 Use |
C1-C4 End of life |
Ecological damage
Human health damage
Additional environmental information
| Impact category | Unit | ||||||
| Fossil fuel depletion | MJ surplus Mega Joule, lower heating value Fossil fuel depletion is the surplus energy to extract minerals and fossil fuels. |
3.26E-01 | 1.27E-01 | 9.52E-02 | 1.02E-03 | 0 | 2.77E-02 |
| Ecotoxicity | CTUe Comparative Toxic Units of Ecotoxicity Ecotoxicity causes negative impacts to ecological receptors and, indirectly, to human receptors through the impacts to the ecosystem. |
71.3 % | 1.3 % | 22.5 % | 0.1 % | 0 % | 4.7 % |
Wilkes-Barr, PA - TRACI v2.1 results per functional unit
| Life cycle stage | A1-A2 RM supply & transport | A3 Manufacturing |
A4 Distribution |
A5 Installation |
B1-B7 Use |
C1-C4 End of life |
Ecological damage
Human health damage
Additional environmental information
| Impact category | Unit | ||||||
| Fossil fuel depletion | MJ surplus Mega Joule, lower heating value Fossil fuel depletion is the surplus energy to extract minerals and fossil fuels. |
3.74E-01 | 6.38E-02 | 1.31E-01 | 1.02E-03 | 0 | 2.77E-02 |
| Ecotoxicity | CTUe Comparative Toxic Units of Ecotoxicity Ecotoxicity causes negative impacts to ecological receptors and, indirectly, to human receptors through the impacts to the ecosystem. |
69.4 % | 0.8 % | 25.8 % | 0.1 % | 0 % | 3.9 % |
References
LCA Background Report
Applegate-Greenfiber SANCTUARY LCA Background Report (public version), Applegate-Greenfiber 2022; SimaPro Analyst 9.4; Ecoinvent v3 and US ecoinvent (US -EI 2.2) database; TRACI 2.1.
PCRs
ISO 21930:2017 serves as the core PCR along UL Part A.
ULE PCR Part A: Life Cycle Assessment Calculation Rules and Report Requirements v3.1
February, 2018. Technical Advisory Panel members reviewed and provided feedback on content written by UL Environment and USGBC. Past and present members of the Technical Advisory Panel are listed in the PCR.
ULE PCR Part B: Building Envelope Thermal Insulation EPD Requirements v2.0
April 2018. PCR review conducted by: Thomas Gloria, PhD (Industrial Ecology Consultants); Christoph Koffler, PhD (thinkstep); and Andre Desjarlais (Oak Ridge National Laboratory).
UL Environment General Program Instructions v2.5, March 2021 (available upon request)
ISO 14025, “Sustainability in buildings and civil engineering works -- Core rules for environmental product declarations of construction products and services”
Download PDF SM Transparency Report, which includes the additional EPD content required by the UL Environment PCR.
SM Transparency Reports (TR) are ISO 14025 Type III environmental declarations (EPD) that enable purchasers and users to compare the potential environmental performance of products on a life cycle basis. Environmental declarations from different programs (ISO 14025) may not be comparable. Comparison of the environmental performance of Building Envelope Thermal Insulation using EPD information shall be based on the product’s use and impacts at the building level, and therefore EPDs may not be used for comparability purposes when not considering the building energy use phase as instructed under this PCR. Full conformance with the PCR for Building Envelope Thermal Insulation allows EPD comparability only when all stages of a life cycle have been considered. However, variations and deviations are possible”. Example of variations: Different LCA software and background LCI datasets may lead to differences results for upstream or downstream of the life cycle stages declared.