LCA & material health results & interpretation Standard EcoPower® 0.35 GPM Faucet TEL103 Series
Scope and summary
- Cradle to gate
- Cradle to gate with options
- Cradle to grave
Functional unit
One faucet in an average U.S. commercial environment for 3 years. The period of 3 years is modeled as the period of application based on the average technical lifespan for commercial applications. The economical lifespan of commercial applications can be longer or shorter due to aesthetic replacements or more intense use. The implication is that the LCA model assumes that the application ends at year 3 and that the materials will be treated in an end-of-life scenario.
Reference service life: 3 years
Data reporting period: 2016
Default use phase scenario
* TEL103-D10E: 3 years of service in an average U.S. commercial environment with 0.06 gallon/use and 90 uses/day resulting in 4,212 gallons of water.
TEL103-D20E: 3 years of service in an average U.S. commercial environment with 0.12 gallon/use and 90 uses/day resulting in 8,424 gallons of water.
What’s causing the greatest impacts
All life cycle stages
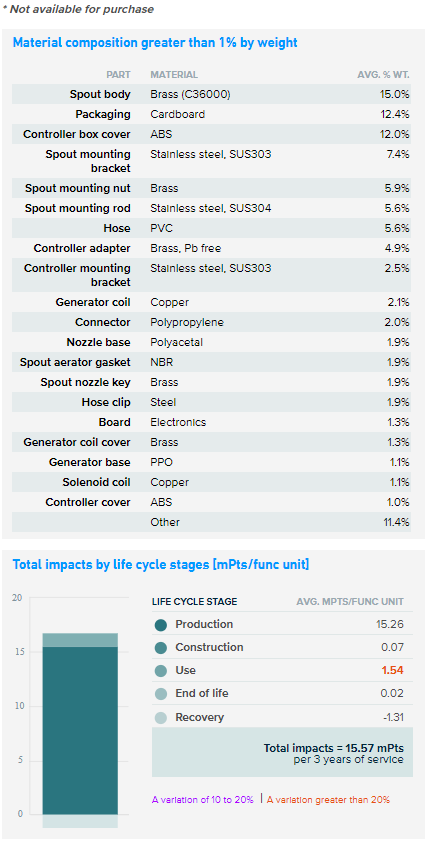
The production stage is dominating the results for most impact categories. The production stage has the most significant contributions to eutrophication (mostly from emissions from copper mining and the printed wiring board), non-carcinogens (emissions from the production of copper and zinc) and ecotoxicity (mostly from disposal of steel slags and bottom ashes from coal fired power plants, and barium emissions to water from the extraction process of natural gas). The use phase is relevant to most impact categories, especially fossil fuel depletion, ozone depletion, and global warming. The use stage impact is mostly due to the embedded energy arising from acquisition, treatment and distribution of the water used during the use of the product.
The recovery stage includes recycling processes and benefits by preventing the need to produce primary materials. Recycling is a relevant factor for some of the impact categories, offsetting a portion of the impacts caused by production. Additionally, the delivery of the product to the construction/installation site, the construction/installation processes, the processes for dismantling the product and final waste treatment during the end of life stage do not have a significant impact.
Production stage
Brass parts and the printed wiring board, along with the brass turning process have significant contributions to the impact categories. Stainless steel materials and the turning steel process are relevant to the carcinogenics category. The electroplating process along with injection molding are major contributors to the ozone depletion category. Additionally, polishing has a somewhat significant processing contribution to the results. Transport via oceanic freighter appears as a relevant contributor to the fossil fuel depletion and smog categories.
Sensitivity analysis
Because the assembly parts are identical between the two faucets, deviations in the LCA results are a result of the difference in the use phase of the two products. The 20-second cycle uses more water per cycle than the 10-second cycle version of the two faucets.
Multi-product weighted average
Results represent the weighted average using production volumes for the products covered. Variations of specific products for differences of 10-20% against the average are indicated in purple; differences greater than 20% are indicated in red. A difference greater than 10% is considered significant.
TOTO PeoplePlanetWater™ programs improving environmental performance
- TOTO’s EcoPower® products are powered by the force of running water.
- The electronic and mechanical components are programmed and designed to allow water flow and accurate flush volume only when needed.
- Water consumption is reduced in the use phase due to superior flushing performance.
LCA results
| Life cycle stage | Production | Construction | Use | End of Life | Recovery |
|
Information modules: Included | Excluded Reuse and energy recovery are not modeled for sanitary fittings. |
A1 Raw Materials | A4 Transportation/ Delivery | B1 Use | C1 Deconstruction/ Demolition | D Reuse, recovery and/or recycling |
| A2 Transportation | A5 Construction/ Installation | B2 Maintenance | C2 Transportation | ||
| A3 Manufacturing | B3 Repair | C3 Waste processing | |||
| B4 Replacement | C4 Disposal | ||||
| B5 Refurbishment | |||||
| B6 Operational energy use | |||||
| B7 Operational water use | |||||
 |
 |
 |
 |
 |
SM Single Score
Learn about SM Single Score results| Impacts per 3 years of service | 15.26 mPts | 0.07 mPts | 1.54 mPts | 0.02 mPts | -1.31 mPts |
| Materials or processes contributing >20% to total impacts in each life cycle stage | Brass parts together with the printed wiring board in addition to manufacturing processes such as brass turning. | Transportation of the product to installation site or consumer and disposal of packaging. | Volume of water use during the operation of the product and the embedded energy use (such as electricity) in the water used. | Transport to waste processing, waste processing and disposal of material flows transported to a landfill. | Plastic and metal components' recycling processes. |
TRACI v2.1 results per one faucet
- A variation of 10 to 20%
- |
- A variation greater than 20%
| Life cycle stage | Production | Construction | Use | End of Life | Recovery |
Ecological damage
Human health damage
Resources depletion
| Impact category | Unit | |||||
| Fossil fuel depletion | MJ surplus Mega Joule surplus Fossil fuel depletion is the surplus energy to extract minerals and fossil fuels. |
4.11E+01 | 1.13E+00 | 1.29E+01 | -9.67E-01 | -1.94E+00 |
References
LCA Background Report
TOTO Sanitary Fittings Products LCA Background Report (public version), July 2016
SM Transparency Report Framework
Part A: LCA Calculation Rules and Background Report Requirements v2017 (compliant with ISO14040-44 and ISO14025)
Part B: Product Group Definition – Commercial Lavatory Faucets
Transparency Reports™ / environmental product declarations enable purchasers and users to compare the potential environmental performance of products on a life cycle basis. They are designed to present information transparently to make the limitations of comparability more understandable. TRs/EPDs of products that conform to the same PCR and include the same life cycle stages, but are made by different manufacturers, may not sufficiently align to support direct comparisons. They therefore, cannot be used as comparative assertions unless the conditions defined in ISO 14025 Section 6.7.2. ‘Requirements for Comparability’ are satisfied.