LCA results & interpretation Havelock Wool Batt and Loose-fill Insulation
Scope and summary
- Cradle to gate
- Cradle to gate with options
- Cradle to grave
Application
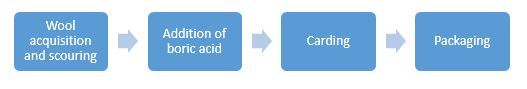
Havelock has applied unique insulating technology to traditional batt and loose-fill insulation. They are made with 100% wool, no synthetic mix, and are bonded with a needle punch, not chemicals. The applications for this insulation include thermal and acoustical treatments to walls for residential purposes. Insulation is delivered to the installation site pre-packaged and easy to install.
Functional unit
Reference service life: 75 years. One square meter of installed insulation material, packaging included, with a thickness that gives an average thermal resistance of RSI=1m2·K/W over a period of 75 years.
Batts
Reference flow: .997 kg per m^2
Thickness: .0399 m
Loose-fill
Reference flow: .607 kg per m^2
Thickness: .0335 m
Manufacturing data
Reporting period: January 2019-December 2019
Location: Reno, NV
Data represents a mix of primary data from Havelock on the production of the insulation products (gate-to-gate) and background data from SimaPro databases. The quality is considered to be high and representative of the described systems. Data for material processing and product manufacturing were collected in a consistent manner and were checked for plausibility of inputs and outputs to ensure high quality.
Default installation, packaging, and disposal scenarios
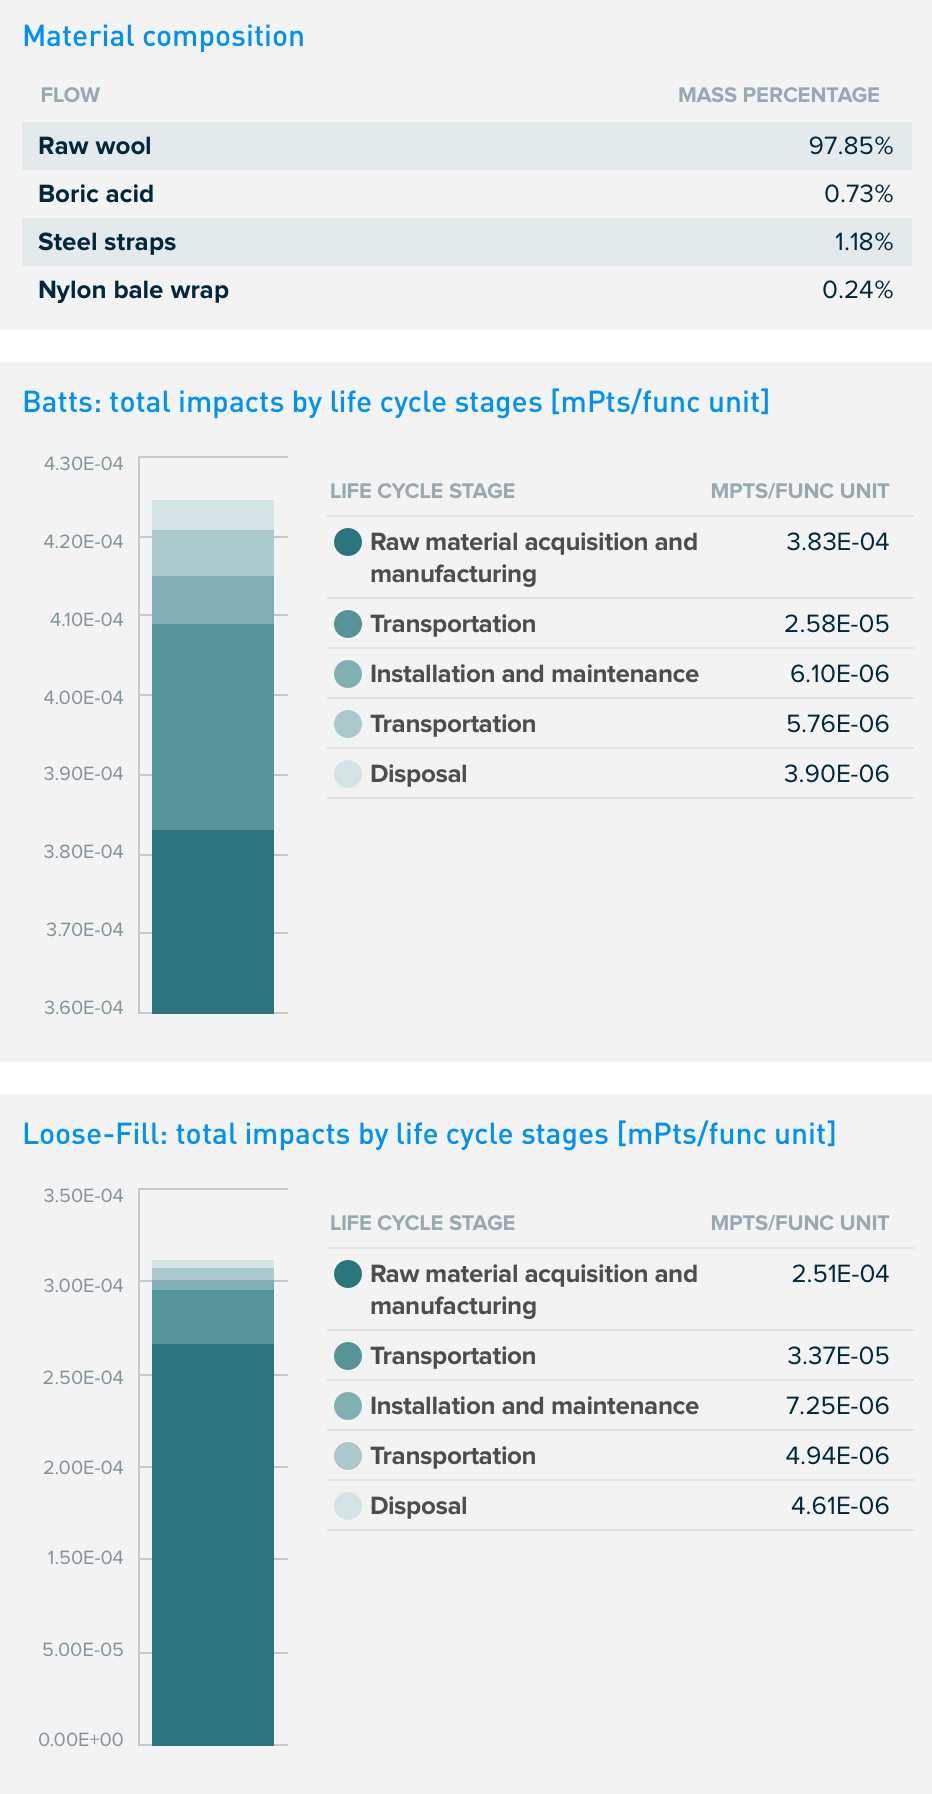
During manufacturing stage, 1652 kg/yr of metal straps and nylon bale wraps, used for acquisition of raw material, are recycled.
At the installation site, insulation products are unpackaged and installed by hand with a blowing machine or a staple gun. The potential impact of the blower is included in this study. The thickness and density of batts being is .0399m and 24.98 kg/m^3 and thickness and density of loose-fill is .0335m and 18.1 kg/m^3.
Plastic packaging waste is disposed (100% to landfill), and no maintenance, replacements, refurbishments, or operational energy/water use is required to achieve the product's life span during use; use is strictly for insulation in walls. After removal, the insulation is meant to be composted or it can be landfilled.
What’s causing the greatest impacts
All life cycle stages
The raw material acquisition and manufacturing stages (A1-A3) and the distribution transportation (A4) dominate the results for all impact categories. Ecotoxicity, Fossil fuel depletion, and global warming potential are the most impacted categories. The impacts are from the use of boric acid, transportation of raw materials to the manufacturing facility and transportation for distribution of the product.
End of life (C1-C4)
Wool is a biogenic material, which is a material produced directly by the physiologic activities of organisms, either plant or animal. Havelock encourages composting as the optimal end of life method. However, when wool is landfilled, it is anticipated that it biodegrades after 6 months. No substances required to be reported as hazardous are associated with the production of this product.
Interpretation of results
Overall, over 80% of the impacts are in A1-A3. The results show that the largest area for reduction of each product’s environmental impact is in the raw material acquisition and manufacturing phase. The impacts in the stage are largely due to transportation from raw material acquisition site to the plant. This is an important area for Havelock to focus its efforts and one which it can influence.
Different end of life scenarios were compared: compost vs landfill and it was found that in both cases, the overall impacts due to end of life scenarios are negligible; the contribution of end of life scenario is less than 2% of overall impacts, therefore holds little significance.
How we're making it greener
Havelock Wool has established itself around the concept of the circular economy; Havelock aims at eliminating waste and the continual use of non-renewable resources by using waste from other industries and creating a product that can be returned to the economy.
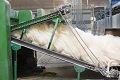
Raw material acquisition: Havelock purchases sheep wool as a biproduct of the meat production industry. By using this wool, Havelock reduces its impacts by eliminating the impacts associated with sheep husbandry.
Waste management: Havelock practices healthy waste management through composting; waste from the manufacturing process (wool dust) is composted and the final product at end of life can also be composted.
Energy consumption: Havelock uses minimal energy during the manufacturing stage and it is looking for ways to get electricity from renewable resources.
Havelock is continuously finding ways to make improvements to their product and to their process. Havelock will make use of this EPD to make evidence based decisions regarding their product and supply chain.
LCA results
| Life cycle stage | A1-A3 Raw material acquisition and manufacturing | A4 Transportation | A5, B1-B7 Installation and maintenance | C2 Transportation | C4 Disposal/reuse/ recycling |
|
Information modules: Included | Stages C1, C3, and D are not applicable *In the installation and maintenance phase, packaging waste and electricity or gas used by the insulation blowing machines in module A5 are the only contributors to the potential impacts. |
x A1 Raw Materials | x A4 Transporation/ Delivery | x A5 Construction/ Installation | x C2 Transportation | x C4 Disposal |
| x A2 Transportation | x B1 Use | ||||
| x A3 Manufacturing | x B2 Maintenance | ||||
| x B3 Repair | |||||
| x B4 Replacement | |||||
| x B5 Refurbishment | |||||
| x B6 Operational energy use | |||||
| x B7 Operational water use | |||||
 |
 |
 |
Batts: SM Single Score
Learn about SM Single Score results| Impacts per 75 years of service | 3.83E-04 mPts | 2.58E-05 mPts | 6.10E-06 mPts | 5.76E-06 mPts | 3.90E-06 mPts |
| Materials or processes contributing >20% to total impacts in each life cycle stage | Boric acid used in the production of the insulation. | Truck and trailer, 16-32T used to transport product to building site. | Transportation to disposal and disposing of packaging materials. | Transportation to composting site. | Compost of product. |
Batts: TRACI v2.1 results per functional unit
| Life cycle stage | Raw material acquisition and manufacturing | Transportation | Installation and maintenance | Transportation | Disposal/reuse/ recycling |
Ecological damage
Human health damage
| Impact category | Unit | |||||
| Carcinogenics | CTUh Comparative Toxic Units of Human cancerous toxicity Carcinogens have the potential to form cancers in humans. |
1.17E-07 | 4.60E-09 | 8.84E-10 | 9.41E-10 | 7.77E-10 |
| Non-carcinogenics | CTUh Comparative Toxic Units of Human non-cancerous toxicity Non-Carcinogens have the potential to causes non-cancerous adverse impacts to human health. |
4.00E-07 | 2.87E-08 | 8.48E-09 | 5.92E-09 | 3.07E-09 |
| Respiratory effects | kg PM2.5 eqKilograms of Particulate Matter equivalent which are smaller than or equal to 2.5 micrometers in diameter Particulate matter concentrations have a strong influence on chronic and acute respiratory symptoms and mortality rates. |
5.04E-03 | 1.13E-04 | 1.01E-05 | 2.88E-05 | 5.64E-05 |
Additional environmental information
| Impact category | Unit | |||||
| Ecotoxicity | CTUe Comparative Toxic Units of Ecotoxicity Ecotoxicity causes negative impacts to ecological receptors and, indirectly, to human receptors through the impacts to the ecosystem. |
4.31E+00 | 2.23E-01 | 1.64E-01 | 4.59E-02 | 1.58E-02 |
| Fossil fuel depletion | MJ surplus Mega Joule, lower heating value Fossil fuel depletion is the surplus energy to extract minerals and fossil fuels. |
3.09E+00 | 7.31E-01 | 1.23E-01 | 1.64E-01 | 3.26E-02 |
Loose-fill: SM Single Score
Learn about SM Single Score results| Impacts per 75 years of service | 2.51E-04 mPts | 3.37E-05 mPts | 7.25E-06 mPts | 6.80E-06 mPts | 4.61E-06 mPts |
| Materials or processes contributing >20% to total impacts in each life cycle stage | Boric acid used in the production of the insulation. | Truck and trailer, 16-32T used to transport product to building site. | Transportation to disposal and disposing of packaging materials. | Transportation to composting Site. | Compost of product. |
Loose-fill: TRACI v2.1 results per functional unit
| Life cycle stage | Raw material acquisition and manufacturing | Transportation | Installation and maintenance | Transportation | Disposal/reuse/ recycling |
Ecological damage
Human health damage
| Impact category | Unit | |||||
| Carcinogenics | CTUh Comparative Toxic Units of Human cancerous toxicity Carcinogens have the potential to form cancers in humans. |
7.32E-08 | 5.51E-09 | 1.05E-09 | 1.11E-09 | 9.18E-10 |
| Non-carcinogenics | CTUh Comparative Toxic Units of Human non-cancerous toxicity Non-Carcinogens have the potential to causes non-cancerous adverse impacts to human health. |
2.65E-07 | 3.47E-08 | 1.01E-08 | 6.99E-09 | 3.63E-09 |
| Respiratory effects | kg PM2.5 eqKilograms of Particulate Matter equivalent which are smaller than or equal to 2.5 micrometers in diameter Particulate matter concentrations have a strong influence on chronic and acute respiratory symptoms and mortality rates. |
3.12E-03 | 1.69E-04 | 1.24E-05 | 3.41E-05 | 6.67E-05 |
Additional environmental information
| Impact category | Unit | |||||
| Ecotoxicity | CTUe Comparative Toxic Units of Ecotoxicity Ecotoxicity causes negative impacts to ecological receptors and, indirectly, to human receptors through the impacts to the ecosystem. |
3.02E+00 | 2.69E-01 | 1.94E-01 | 5.42E-02 | 1.87E-02 |
| Fossil fuel depletion | MJ surplus Mega Joule, lower heating value Fossil fuel depletion is the surplus energy to extract minerals and fossil fuels. |
2.18E+00 | 9.59E-01 | 1.48E-01 | 1.93E-01 | 3.86E-02 |
References
Havelock Wool LCA Background Report, May 2020.
Havelock 2020. SimaPro Analyst 9.0.0.49, EcoInvent 3.1, 2.2 database.
ULE PCR Part A: Life Cycle Assessment Calculation Rules and Report Requirements v3.1
May 2, 2018. Technical Advisory Panel members reviewed and provided feedback on content written by UL Environment and USGBC. Past and present members of the Technical Advisory Panel are listed in the PCR.
ULE PCR Part B: Building Envelope Thermal Insulation
Version 2.0, April 2018. PCR review conducted by Thomas Gloria, PhD (chair, [email protected]); Andre Desjarlais; and Christoph Koffler, PhD.
ISO 14025, “Sustainability in buildings and civil engineering works -- Core rules for environmental product declarations of construction products and services”, ISO21930:2017
Independent external verification of the declaration and data, according to ISO 14025.
Download PDF SM Transparency Report/Material Health Overview, which includes the additional EPD content required by the PCR.
SM Transparency Reports (TR) are ISO 14025 Type III environmental declarations (EPD) that enable purchasers and users to compare the potential environmental performance of products on a life cycle basis. Environmental declarations from different programs (ISO 14025) may not be comparable. They are designed to present information transparently to make limitations of comparability more understandable. Limitations of LCA results for products represent production volumes for the Reno, NV facility only. TRs/EPDs of products that conform to the same PCR and include the same life cycle stages, but are made by different manufacturers, may not sufficiently align to support direct comparisons. They therefore, cannot be used as comparative assertions unless the conditions defined in ISO 14025 Section 6.7.2. 'Requirements for Comparability' are satisfied. Comparison of the environmental performance of building envelope thermal insulation using EPD information shall be based on the products use and impacts at the building level, and therefore EPDs may not be used for comparability purposes when not considering the building energy use phase as instructed under the PCR. Environmental declarations from different programs based upon differing PCRs may not be comparable. Full conformance with the PCR for building envelope thermal insulation allows EPD comparability only when all stages of a life cycle have been considered, when they comply with all referenced standards, use the same sub-category PCR and use equivalent scenarios with respect to construction works. Compliance with model building codes does not always ensure compliance with state or local building codes, with may be amended versions of these model codes. Always check with local building code officials to confirm compliance. However, variations and deviations are possible. Example variations: Different LCA software and background LCI data sets may lead to different results upstream or downstream of the life cycle stages declared.