LCA & material health results & interpretation BioEdge® Edgebanding
Scope and summary
- Cradle to gate
- Cradle to gate with options
- Cradle to grave
Application
Bioplastic Solutions designs and manufactures BioEdge®. It is a furniture/casework product which seals exposed and raw edges and is made primarily with bio-based materials (a byproduct of corn or sugarcane production). It is a competitively priced alternative to petro-chemical based plastics.
Product description
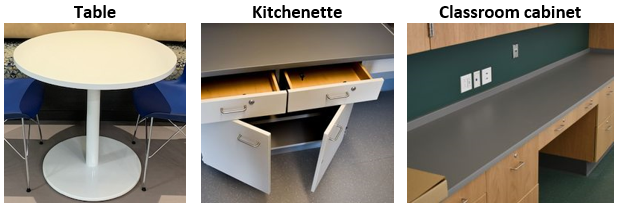
Three different reference products have been considered in this LCA study: table, kitchenette, and classroom cabinet. For the purpose of satisfying the PCR categories, the table is considered benching while kitchenette and classroom cabinet are considered panels in addition with other office components. The reference flows used in this LCA is to support 4 occupants for table and kitchenette, while classroom cabinet supports 6 occupants. The data reported is based on 1 m2 of floorspace.
Functional unit
Functional unit is one square meter of workspace for a period of 10 years.
BioEdge® has been and can be a component of furniture that meets ANSI/BIFMA X5.5-2021 Desk/Table Products. Per technical data sheet, if all guidelines for installation and application of hot melt adhesives to the edging are followed correctly, BioEdge® will remain on the unit permanently and warranty will be extended to the same timeframe as the end unit.
Reference products: Table, Kitchentte, and Classroom cabinet
Physical floorspace reported: 0.785 m2 for Table, 2.229 – 5.574 m2 for Kitchentte, and 4.645 - 6.968 m2 for Classroom cabinet
Reference flows: 0.425 lb for Table, 2.45 lb for Kitchenette, and 1.90 lb for Classroom cabinet
Functional units needed: 1.274 for Table, 0.179 - 0.449 for Kitchenette, 0.144 - 0.215 for Classroom cabinet
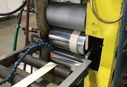
Manufacturing data
Reporting period: Oct. 2020 — Sep. 2021 for energy data and July 2020 — June 2021 for non-energy data
Location: Ellendale, MN
Data represents a mix of primary data from BioPlastic Solutions on the production of BioEdge (gate-to-gate) and their polylactic acid (PLA) supplier, and background data from SimaPro databases. The quality is considered to be high and representative of the described systems. Data for material processing and product manufacturing were collected in a consistent manner and were checked for plausibility of inputs and outputs.
What’s causing the greatest impacts
All life cycle stages
Raw material acquisition and transport stages (A1-A2) dominate the results for most impact categories followed by manufacturing (A3), and installation stage (A5). Together A1-A4 contribute to most of the impacts across the life cycle. A1-A2 stage contributes to ~50% of the total impacts in most of the impact categories except non-carcinogenics and respiratory effects. In case of non-carcinogenics impact, A1-A2 stage has negative contribution which means this stage absorbs more toxic chemicals from the environment than it releases. PLA polymer, a major ingredient for BioEdge, is responsible for this negative value. Manufacturing (A3) stage contributes to much of the non-carcinogenics. Impacts from the installation stage (A5) is mostly due to the hot-melt adhesives.
Raw material acquisition and transport stage
Within A1-A2 stage, raw material acquisition stage (A1) is the main contributor, with less impacts coming from raw material transport (A2) stage. Raw material extraction and processing for PLA polymer, a major ingredient in BioEdge® contributes to majority of the impacts in A1 stage.
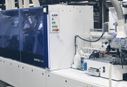
Manufacturing stage
Electricity used during production contributes to almost all of the manufacturing (A3) impacts. Corrugated cardboard used for packaging and distribution also makes considerable impacts.
Sensitivity analysis
For this LCA study, only input that needed allocation was electricity used during manufacturing, while proxy data was used for two input materials. A sensitivity analysis was performed using a range from half to twice the manufacturing electricity input and raw material inputs for those two materials. Total impact results for all impact categories but ecotoxicity and eutrophication have variations greater than 10%.
BioPlastic Solutions is continuing the process of moving to a zero scrap policy by investigating use of scrap as reprocessed material back into BioEdge®. Packaging for raw materials is re-used to ship back out products on our other product lines. Masterbatch mixing has allowed us to more accurately use the correct amount of material for each job. New ERP program will further simplify accuracy on raw material mixes and leaving less in the barrel for each job to be purged.
LCA results
| Life cycle stage | A1-A2 Raw material acquisition and transport |
A3 Manufacturing | A4 Transportation | A5 Installation | B1-B7 Use and maintenance |
C1-C4 End of life |
|
Information modules: Included |
A1 Raw Materials | A3 Manufacturing | A4 Transportation/ Delivery | A5 Installation | B1 Use | C1 Deconstruction |
| A2 Transportation | B2 Maintenance | C2 Waste Transport | ||||
| B3 Repair | C3 Waste Processing | |||||
| B4 Replacement | C4 Disposal | |||||
| B5 Refurbishment | ||||||
| B6 Operational energy use | ||||||
| B7 Operational water use | ||||||
 |
 |
 |
 |
 |
SM Single Score
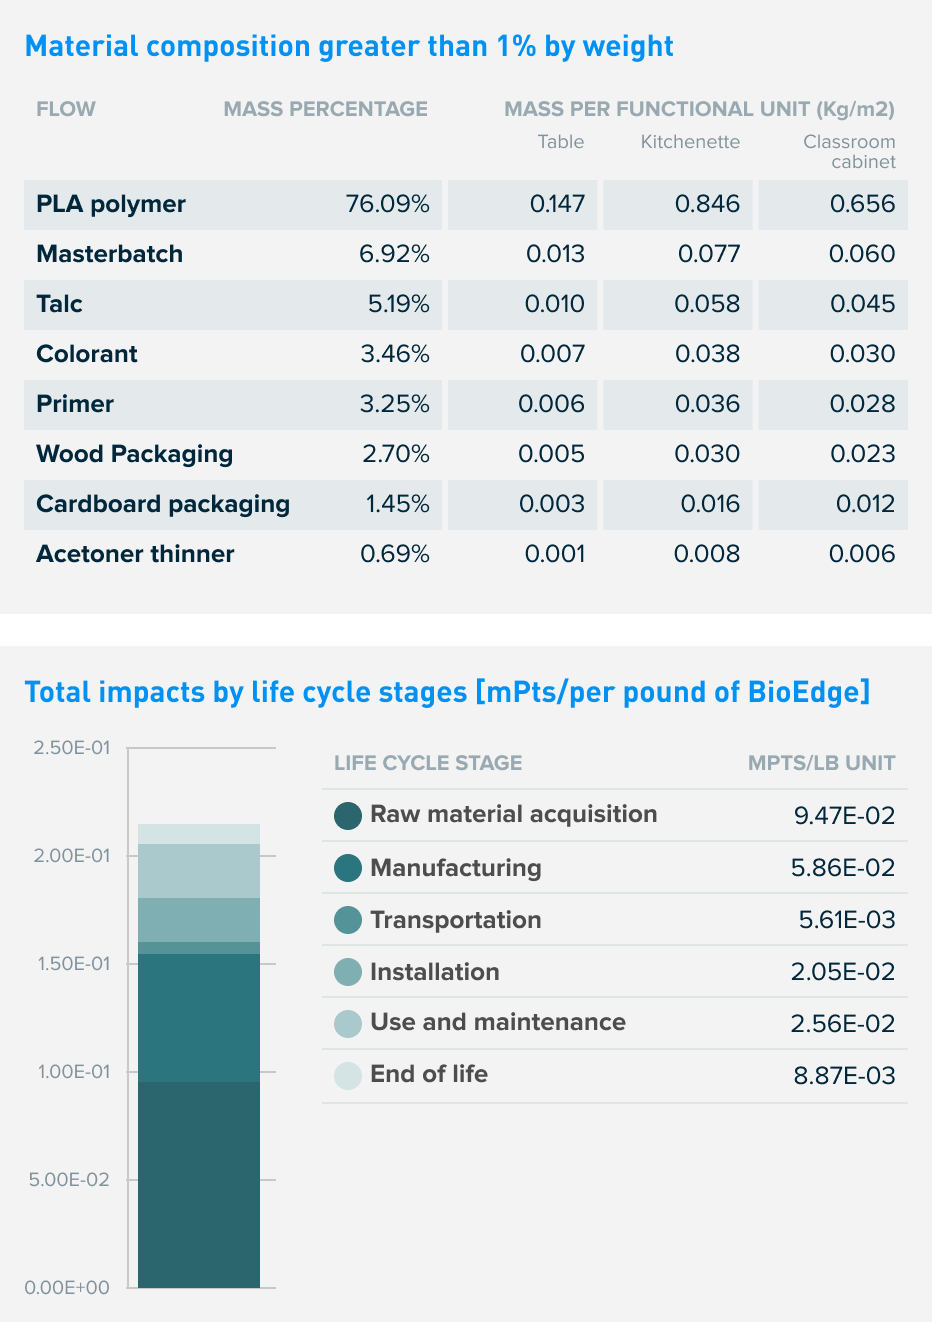
Learn about SM Single Score results| Impacts of 1 pound of BioEdge per 10 years of service | 9.47E-02 mPts | 5.86E-02 mPts | 5.61E-03 mPts | 2.05E-02 mPts | 2.56E-02 mPts | 8.87E-03 mPts |
| Materials or processes contributing >20% to total impacts in each life cycle stage | PLA raw materials and production. | Electricity consumed during BioEdge manufacturing. | Truck and rail transportation used to transport product to building site. | Hot-melt adhesives used for installation | Cleaning agent for periodic cleaning. | Disposal process after the end-of-life. |
Table: TRACI v2.1 results per functional unit
| Life cycle stage | A1-A2 Raw material acquisition and transport |
A3 Manufacturing | A4 Transportation | A5 Installation | B1-B7 Use and maintenance |
C1-C4 End of Life |
Ecological damage
Human health damage
Additional environmental information
Kitchenette: TRACI v2.1 results per functional unit
| Life cycle stage | A1-A2 Raw material acquisition and transport |
A3 Manufacturing | A4 Transportation | A5 Installation | B1-B7 Use and maintenance |
C1-C4 End of Life |
Ecological damage
Human health damage
Additional environmental information
Classroom cabinet: TRACI v2.1 results per functional unit
| Life cycle stage | A1-A2 Raw material acquisition and transport |
A3 Manufacturing | A4 Transportation | A5 Installation | B1-B7 Use and maintenance |
C1-C4 End of Life |
Ecological damage
Human health damage
Additional environmental information
References
LCA Background Report
BioEdge® Edgebanding LCA Background Report (public version), BioPlastic Solutions 2021. SimaPro Analyst 9.2, EcoInvent 3.7 database.
BIFMA PCR for Office Furniture Workspace Products: UNCPC 3814
Valid through July 31, 2022. PCR review conducted by Jack Geibig (chair, [email protected]); Thomas Gloria, PhD ([email protected]); and Dr. Michael Overcash ([email protected]).
SM Transparency Reports (TR) are ISO 14025 Type III environmental declarations (EPD) that enable purchasers and users to compare the potential environmental performance of products on a life cycle basis. Environmental declarations from different programs (ISO 14025) may not be comparable. They are designed to present information transparently to make the limitations of comparability more understandable. TRs/EPDs of products that conform to the same PCR and include the same life cycle stages, but are made by different manufacturers, may not sufficiently align to support direct comparisons. They therefore, cannot be used as comparative assertions unless the conditions defined in ISO 14025 Section 6.7.2. ‘Requirements for Comparability’ are satisfied. When attempting to compare EPDs or life cycle impacts of products from different companies, the user should be aware the uncertainty in the final results due to and not limited to the practitioner's assumptions, the source of the data used in the study, and the software tool used to conduct the study. Different LCA software and background LCI data sets may lead to different results upstream or downstream of the life cycle stages declared.